
What Makes a Crypto Trading Strategy Work? 5 Components and Where Each Strategy Type Breaks

Quick answer: A crypto trading strategy is a defined set of rules for entries, exits, position sizing, and risk, applied to a chosen market and timeframe. Writing those rules down is what turns a market opinion into a repeatable process you can test on historical data before any money is at stake.
Many traders arrive at crypto with a view, not a system. Rather than a glossary of strategy types, this guide breaks a strategy into five components you can define, then shows the market condition that breaks each main strategy type, so you know what to test first.
The anatomy of a crypto trading strategy: 5 components to define
This five-part framework is a working checklist, not a universal law: some traders fold sizing and risk limits into one rule, and others add filters or a schedule. What matters is that each decision is made in advance. If one of the five is left undefined, it gets decided in the moment, and that part of the strategy cannot be tested.
1. Entry rules. The conditions that must be met before a position opens. "Buy when the market is panicking" is not an entry rule; "open a long when RSI(14) closes below 30 on the daily chart" is, because two people could execute it identically. Not every view converts to rules; what can and cannot be tested is covered in Technical vs Fundamental Analysis for Crypto.
2. Exit rules. A position needs a defined way out, and many strategies carry two: a take-profit for when the thesis plays out, and a stop for when it does not. Exits shape average win size and time in market; improvising them is a common way entry-focused traders give back their gains. The distance between the two is a risk-reward decision you can backtest.
3. Position sizing. How much capital goes into each trade. This choice can matter as much as the entry itself: same entries, different sizing, different returns and drawdowns. Approaches range from fixed-percentage sizing to volatility-adjusted sizing, a topic with frameworks of its own, such as the Kelly Criterion for crypto.
4. Risk limits. The portfolio-level rules that cap damage beyond any single trade: maximum stop distance, concurrent positions, per-asset limits, daily loss limits, and the drawdown level that makes you pause. Sizing controls one trade; risk limits control the whole strategy, and they can be the difference between a bad week and a blown account.
5. Market and timeframe scope. Which instrument and timeframe the rules apply to. A set validated on daily Bitcoin candles is not, without fresh testing, a set for 15-minute Ethereum. Scope keeps a strategy honest: it names the conditions the rules were tested under.
A worked example in plain English
Here is a hypothetical rule set, written the way a trader would say it out loud: a simple RSI mean reversion setup on Bitcoin. The parameters are illustrative examples chosen to show all five components, not tested or recommended settings.
| Component | Rule |
|---|---|
| Market and timeframe | BTC/USDT, daily candles |
| Entry | Open a long when RSI(14) closes below 30 |
| Exit | Close when RSI(14) closes back above 50; stop out if price falls 5% below entry |
| Position sizing | 25% of available capital, one position at a time |
| Risk limits | No new entries for the rest of the week after two consecutive stop-outs |
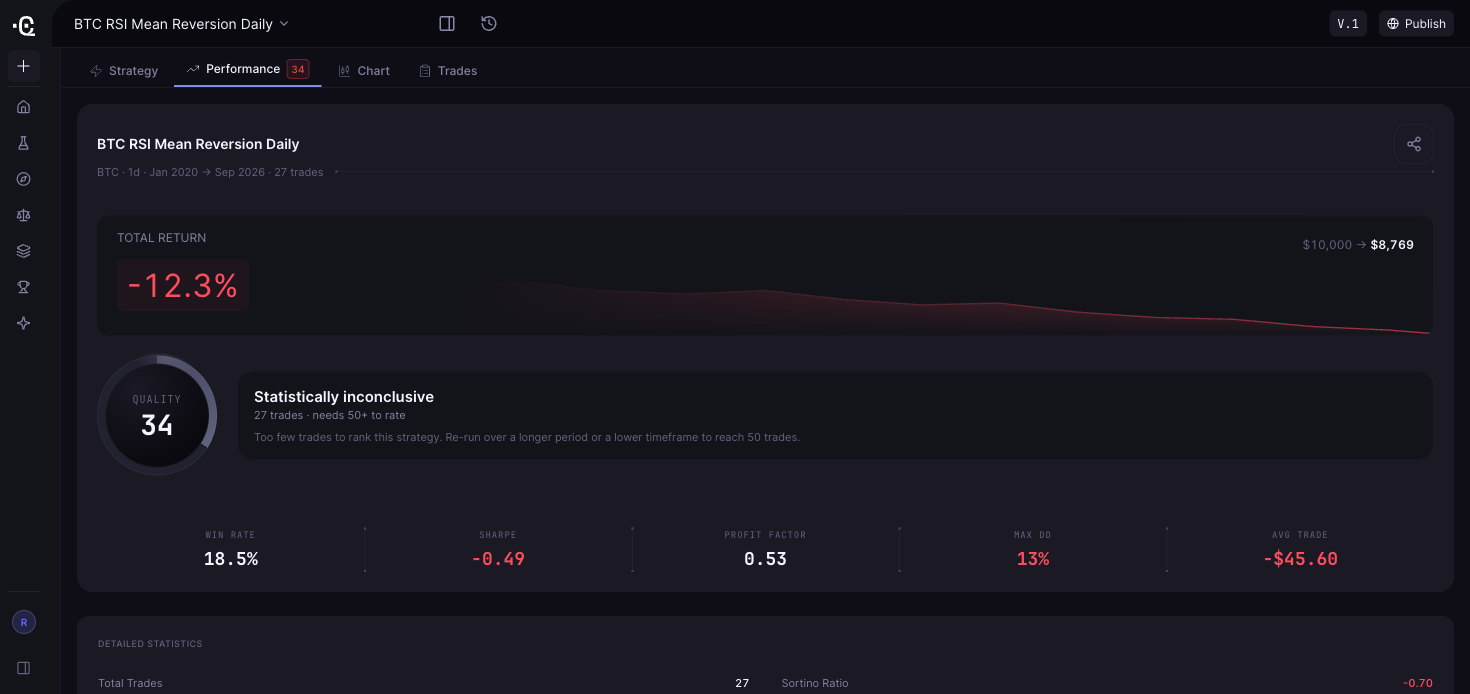
Example CoinQuant results screen for a BTC daily RSI mean-reversion backtest (Jan 2020 to Sep 2026): 27 trades, a negative return, and a Strategy Quality Score marked statistically inconclusive because the sample is too small. A simulation of past data, not a forecast.
Notice what changes once the idea is written down: anyone can execute it identically and, more importantly, check it. Run against historical Bitcoin data, rules like these produce an evidence file instead of an opinion: trade count, win rate, the worst peak-to-trough decline, and what remained after fees. A weak or inconclusive result is still a useful answer, because it arrives before any money is involved, and too few trades is a finding too: a small sample cannot separate an edge from luck. Whether an edge is real is an empirical question, and testing is how you answer it.
The main crypto trading strategy families (and where each one breaks)
Each family works in different conditions and fails in a characteristic way. The failure mode is the part to test first.
Trend-following. Trend strategies ride moves in one direction, entering on strength and exiting on weakness, usually with moving averages or channel breaks as guides. They tend to work best in sustained, directional markets, where a few large moves often deliver most of the profit. Their failure mode is the choppy range: signals flip back and forth, producing strings of small whipsaw losses. Trend followers typically accept a low win rate in exchange for occasional large wins.
Mean reversion. Mean reversion assumes sharp moves away from an average snap back, buying after selloffs and selling after spikes, often keyed to RSI or Bollinger Band extremes. It works in ranging markets and after overextensions, when price is stretched but the regime has not changed. Its failure mode is the strong trend: price keeps going instead of reverting, and the strategy keeps buying into a falling knife.
Breakout. Breakout strategies wait for price to escape a well-defined range, such as a multi-week high, then trade in the direction of the escape, betting that new information is repricing the asset. They work when volatility expands after a quiet stretch, creating the long one-directional moves they are built to catch. The failure mode is the false breakout: price pokes through a level, pulls in entries, then reverses.
Momentum. Momentum assumes recent relative strength persists: buy what has outperformed, avoid or short what has lagged, rebalance on a schedule. It works in trending markets with persistent leadership. It fails at regime rotations, when leaders become laggards and the crowded trade unwinds violently.
DCA and grid styles. Dollar-cost averaging buys a fixed amount on a schedule regardless of price, while grid strategies layer orders across a range to harvest back-and-forth movement. DCA is patient accumulation: it does not need a rising market to be working, but it keeps adding exposure through a prolonged decline, so its risk is how deep and how long the downside lasts. Grids work in rangebound markets where price oscillates without direction, and their failure mode is price leaving the range: in a breakout higher, the grid sells its inventory and stops participating; in a breakdown, it keeps buying and accumulates inventory as price falls. We cover setup and testing for grid strategies and DCA bots separately.
The same families side by side, with the first thing worth testing for each:
| Family | Tends to work when | Breaks when | What to test first |
|---|---|---|---|
| Trend-following | Markets move in one direction for a sustained stretch | Price chops sideways and signals flip back and forth | Loss streaks and drawdown during ranging periods |
| Mean reversion | Price ranges, or overextends without a regime change | A strong trend keeps running instead of reverting | Behavior through a sustained decline, and whether the stop caps losses |
| Breakout | Volatility expands after a quiet stretch | Price breaks a level, pulls in entries, then reverses | How many breakouts fail, and whether a confirmation filter helps |
| Momentum | Leadership persists across assets | Leaders rotate and crowded trades unwind | Results around rotations, and the cost of rebalancing |
| DCA and grid | DCA: long-horizon accumulation through volatility. Grid: choppy or rangebound markets | DCA: a prolonged decline keeps adding exposure. Grid: price breaks out of the range in either direction | DCA: drawdown depth and duration through a long decline. Grid: behavior when price exits the range, and where the range limits sit |
How a crypto trading strategy works: from idea to evidence
A tested strategy typically moves through a loop like this before it deserves capital. The full build process is covered in How to Develop a Crypto Trading Strategy Without Any Coding Experience.
1. Define the rules. Write the five components as sentences a stranger could follow. An idea that cannot be stated precisely cannot be tested; an untested idea is a guess.
2. Backtest against history. Run the rules over historical data for the market and timeframe in scope, with fees, slippage, and fills modeled. The output is a metric set: net return, trade count, win rate, profit factor, Sharpe ratio, and maximum drawdown.
3. Refine, one change at a time. The first backtest is a baseline, not a verdict. Change one variable, rerun, compare, repeat. Simultaneous changes teach nothing about which one mattered, and chasing a prettier curve teaches the strategy to describe its own past instead of the market.
4. Validate out of sample. Hold back a slice of history that played no part in the refinement, and check the strategy there; a later period, or a related market the rules are meant to fit, adds further evidence. If results collapse on unseen data, the earlier numbers were likely curve-fit. The checklist is in How to Know If a Crypto Trading Strategy Will Work Before You Risk Real Money.
5. Decide about live use. Decide whether the strategy has earned capital, and how much. Even validated strategies can degrade: markets adapt, edges decay, and the gap between backtest and reality is where disappointment lives, as covered in Why Your Backtested Crypto Strategy Fails Live.
Each pass strengthens the evidence or exposes a weakness; either way, the lesson arrives before real money is involved.
Why written rules beat improvising
Written rules make decisions consistent and testable: the same conditions produce the same decision, and the rules can be checked against history, which a hunch cannot. They also move the hardest calls to a calm moment in advance. They do not remove emotion, since you still have to follow them through a losing streak, and they guarantee nothing: a strategy can have a real edge and still lose money over a given month. That is variance, not failure. The honest claim is that rules turn trading from an argument into an experiment.
Where CoinQuant fits
CoinQuant is built around this workflow. Describe a strategy in plain English, by typing or speaking, and the AI turns it into a complete system: entries, exits, position sizing, filters, and risk rules. Crypto backtests use market data from partners including Kaiko, with fees and slippage built into the calculation, and return metrics including win rate, maximum drawdown, Sharpe ratio, and a Strategy Quality Score (SQS, 0 to 100) that shows how strong or fragile a result is and flags low-sample results.
Prefer a starting point? CoinQuant's community library lets you filter community strategies by asset, return, timeframe, or SQS, then clone one and refine it as your own. Our guide to using a strategy library walks through the process.
One boundary is worth stating plainly: a backtest is a simulation and places no orders. Whatever a strategy shows on historical data, choosing whether and how to trade it with real money is a separate decision, and that decision carries real risk.
Frequently asked questions
Do crypto trading strategies actually work?
Some do, some do not, and testing is how you tell them apart. A strategy does not need to win most trades; it needs an edge that survives fees and holds up on unseen data. Many promising ideas fail that test, and a backtest costs an afternoon, while finding out live costs capital.
Why do trading strategies stop working?
Usually because the conditions they were built for change: a trend system meets a long range, a mean reversion system meets a strong trend, or costs rise as liquidity thins. Some edges fade as more traders exploit them, and some never existed, because they were tuned too closely to one stretch of history. Testing across different regimes, and knowing each type's failure mode, tells you what to watch for.
Which strategy type fits a ranging market?
Mean reversion and grid styles are built for ranges, because they profit from price swinging back and forth. Both break when the range gives way to a sustained move, so test them through at least one strong trend and define what closes the trade or pauses the grid. Trend-following tends to struggle in ranges, where it takes repeated small losses.
How do I test a crypto trading strategy without risking money?
Backtest it. Turn the idea into rules, run it against historical data with fees and slippage modeled, read the full metric set rather than just the return, then check it on a period that played no part in tuning. If it holds, paper trade before risking capital.
Can a crypto trading strategy guarantee profits?
No strategy, indicator, or platform can guarantee profits, and anyone promising them is selling something else. A strategy structures decisions and controls risk; it can hold a real edge and still lose trades and months. Expect an improved process, not a certainty.
Is a trading strategy the same thing as a trading bot?
Related but different. The strategy is the decision logic: rules for entries, exits, sizing, and risk. A bot is software that executes those rules, usually through an exchange. A bot running an untested strategy can simply lose money faster; a validated strategy can be traded manually or through a bot.
The bottom line
A crypto trading strategy is a defined set of rules, five components deep, that turns a market opinion into something testable. Each strategy type has a condition that breaks it, and knowing that condition tells you what to test first. Rules will not guarantee outcomes, but they replace guessing with evidence you can check before capital is at stake.
Describe a strategy in plain English and backtest it on CoinQuant before you risk capital:
Disclaimer:
Key Takeaway
