Grid Trading Strategy Explained: How to Set It Up and Backtest It
.png)
Grid trading is the top strategy recommendation across every major crypto roundup in June 2026. Bitcoin has been consolidating at cycle highs, and retail traders searching for a way to profit from sideways movement without predicting direction are landing on grid bots in record numbers.
This article explains exactly what grid trading is, how to set up the same logic on CoinQuant without writing a line of code, and what six months of real BTCUSDT data actually shows.
What Grid Trading Is
Grid trading places buy and sell orders at fixed price levels above and below a reference price. When price drops to a lower level, the strategy buys. When price recovers to an upper level, it sells. Profit comes from the oscillation between levels, not from predicting direction.
The approach has three core variables:
Grid spacing: the percentage gap between each buy and sell level
Grid count: how many levels the strategy covers
Range boundaries: the upper and lower price limits before the strategy pauses
A tighter grid captures more small moves but generates more trades and more fees. A wider grid produces bigger wins per trade but fewer opportunities and larger drawdowns if price trends hard in one direction.
The Logic Behind Grid Trading
Grid strategies thrive in one market condition: sideways oscillation. When Bitcoin ranges between a support and resistance zone for weeks, every dip becomes a buy opportunity and every recovery becomes a profitable exit. The strategy does not need to forecast direction. It just needs price to keep bouncing.
The failure mode is equally mechanical: a sustained directional break destroys a grid. If Bitcoin drops 25% without recovering, every buy level fills and none of the sell levels trigger. The strategy accumulates open positions at a loss. This is the single most important thing to understand before deploying any grid or grid-like strategy.
Bollinger Bands replicate grid behavior dynamically. Rather than fixed price levels, a Bollinger Band creates an upper and lower boundary that adjusts automatically with volatility:
When volatility compresses, the bands tighten.
When volatility expands, the bands widen.
This means the grid adjusts to market conditions rather than sitting at static levels that may no longer be relevant.
Setting Up on CoinQuant
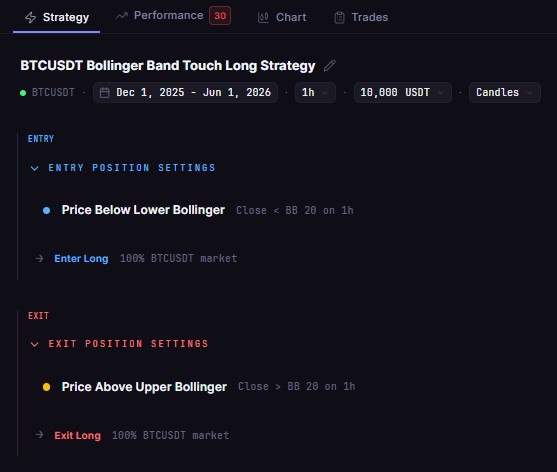
CoinQuant builds strategies from plain-English descriptions. The exact setup used in this backtest:
Instrument: BTCUSDT
Timeframe: 1-hour
Indicator: Bollinger Bands, 20-period, 2.0 standard deviations
Entry rule: buy when price touches the lower Bollinger Band
Exit rule: sell when price touches the upper Bollinger Band
As a plain-English prompt in CoinQuant:
"Buy BTCUSDT on the 1-hour chart when price touches the lower Bollinger Band (20, 2.0). Sell when price reaches the upper Bollinger Band."
Backtest Results: December 2025 to June 2026
The backtest ran on the following conditions:
BTCUSDT 1-hour candles from December 1, 2025 to June 1, 2026
Data sourced through Kaiko via CoinQuant
Trading fees of 0.1% per trade included
Initial capital $10,000. No leverage applied
What the Results Tell You
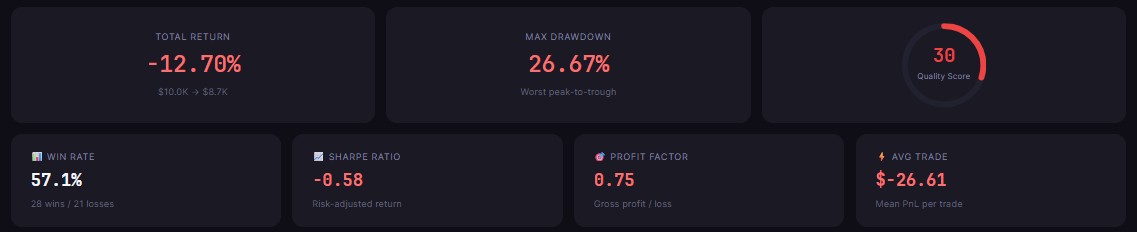
A 57.1% win rate across 49 trades confirms the logic worked more often than not. In 28 of 49 cases, price that touched the lower Bollinger Band recovered to the upper band and closed the trade profitably.
The -12.70% total return tells the rest of the story. The 21 losing trades were not small losses. Each one represents a case where price touched the lower band, the strategy entered long, and Bitcoin continued lower without recovering. The directional moves in early 2026 generated the majority of those losses.
The Sharpe Ratio of -0.58 confirms the strategy delivered negative risk-adjusted returns. For every unit of volatility the strategy absorbed, it generated a net loss, meaning the risk taken was not compensated by the return produced.
A Sharpe below zero indicates underperformance relative to simply holding cash.
The Profit Factor of 0.75 reinforces the same picture: for every $1.00 lost across all trades, the strategy generated only $0.75 in gross profit. Wins were frequent, but the average losing trade was larger than the average winning trade. The average trade result of -$26.61 per position, across 49 trades, produced the total drawdown seen.
Three specific takeaways from this data:
49 trades across six months on a 1-hour chart means high frequency. At 0.1% fees per trade, the cumulative cost compounds meaningfully. Widening the band to 2.5 standard deviations or moving to the 4-hour timeframe reduces trade count and lowers fee drag.
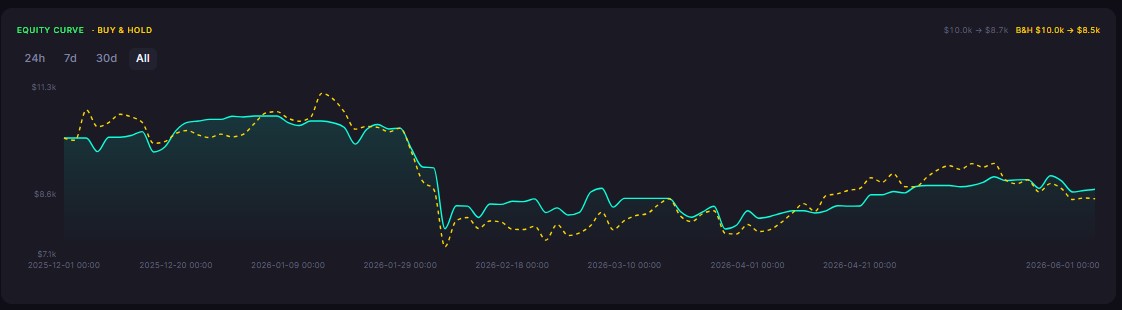
A -26.67% max drawdown on a strategy built for a "safe" ranging market reflects the periods when BTC trended hard against the range assumption. The strategy held losing positions through those moves.
Win rate alone does not tell you whether a strategy is profitable. The full backtest does, and that is exactly what the -12.70% return, -0.58 Sharpe, and 0.75 Profit Factor reveal together: wins were frequent, but losers were larger than winners on average.
Three Mistakes Grid Traders Make
Running grid logic in a trending market. This backtest shows the cost directly. A strategy built for oscillation does not adapt when Bitcoin decides to trend. Before deploying any grid strategy live, confirm the market structure is genuinely ranging, not trending with shallow pullbacks.
Setting grid spacing too tight. Spacing below 1% on Bitcoin's 1-hour chart generates entries and exits on noise rather than genuine swings. High trade count plus compounding fees reduces profitability even when win rate looks strong.
No maximum drawdown limit. If price drops through all grid levels and keeps falling, the strategy needs a hard stop. Running a grid without a defined loss ceiling is one of the most common gaps between a backtested strategy and a live deployment.
Run this backtest free on CoinQuant: no coding required. Adjust the Bollinger Band period, standard deviation, or timeframe and see how the results change across different market conditions.
Disclaimer:
This content is for educational and informational purposes only and does not constitute financial, investment, or trading advice. All strategies and examples are for illustrative purposes and do not guarantee results. Always conduct your own research before making financial decisions.
Key Takeaway