What Is a DCA Bot and How Does It Actually Work?
.png)
DCA bots appear in every beginner recommendation list published in June 2026. Every major bot comparison article names them as the safest starting point. This article explains exactly how a DCA bot works, what it is actually doing when it fires, and what a real backtest on Bitcoin shows about whether the logic holds up under realistic conditions.
What a DCA Bot Is
A DCA bot executes a dollar-cost averaging strategy automatically. It buys a fixed amount of a cryptocurrency at regular intervals or when a defined trigger condition is met, regardless of current price. The core premise: by spreading purchases over time rather than committing capital in one transaction, you reduce the risk of buying at a single peak and improve your average entry price over a full market cycle.
Dollar-cost averaging as a concept predates crypto entirely. It originated in traditional equity markets as a disciplined alternative to lump-sum investing. Applied to Bitcoin and major altcoins, it translates directly: instead of asking when the right time to buy is, you remove the timing decision and replace it with a rule. The rule is what the bot enforces.
A DCA bot removes the emotional layer from this process. Instead of manually deciding when to buy, the bot executes the strategy mechanically based on pre-set conditions.
In practice, this matters because most manual buyers in crypto markets do the opposite of what produces a good average entry price: they buy more when momentum is high and prices are elevated, and hesitate or stop buying during corrections when prices are lower.
A bot configured to buy on weakness enforces the discipline that most traders cannot maintain manually, executing the same rule in a correction as it does in a quiet market.
How a DCA Bot Fires
There are two main trigger types for DCA bots:
Time-based DCA is the purest form. Indicator-based DCA adds a filter that attempts to buy more intelligently during price weakness, rather than at fixed intervals that may coincide with local tops. The practical difference: time-based DCA might deploy capital on a set day each month regardless of whether Bitcoin is up 20% that week.
Indicator-based DCA waits for a condition (RSI dropping below a threshold, for example) before triggering the entry, which biases purchases toward periods of relative weakness. Neither approach guarantees a lower average entry price, but the indicator-based approach attempts to improve entry timing at the cost of added complexity that must be backtested before deployment.
Setting Up a DCA Bot Strategy on CoinQuant
CoinQuant uses indicator-based strategy logic. The DCA bot equivalent is an RSI dip-and-recovery entry: the bot enters a position when the RSI signals oversold conditions and begins recovering, then closes the position when the RSI reaches overbought territory. RSI(14) on the daily chart is a reasonable starting point for this logic.
A reading below 40 suggests the market has pulled back from recent highs; waiting for the RSI to cross back above 40 adds a recovery confirmation before committing capital: the strategy does not buy a falling knife, it waits for the first sign of recovery before entering a position.
Instrument: BTCUSDT
Timeframe: Daily
Entry: RSI(14) crosses above 40 after dropping below 40
Exit: RSI(14) crosses above 65
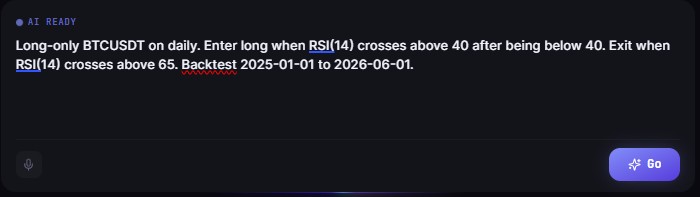
As a plain-English prompt in CoinQuant: "Long-only BTCUSDT daily. Enter when RSI(14) recovers above 40 from below. Exit when RSI(14) reaches 65. Backtest January 2025 to June 2026."
Backtest Results: January 2025 to June 2026
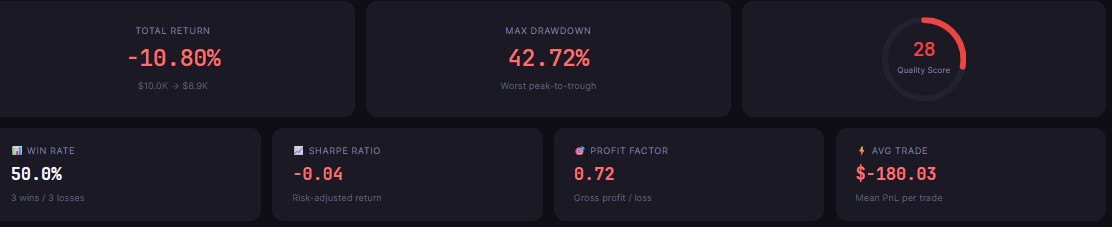
18-month backtest on BTCUSDT daily. Kaiko data via CoinQuant. Fees at 0.1% per trade. No leverage. Initial capital $10,000.
What the Results Reveal
A 50% win rate on six trades means half the entries produced profitable closes. The -10.80% total return reflects the losing trades outweighing the winners in size: the account moved from $10,000 to $8,920 over 18 months. Six trades over 18 months is a low frequency by most strategy standards.
This is expected for a daily RSI strategy on Bitcoin: the RSI(14) does not cross the 40 level frequently enough to generate many signals, and each trade carries significant position weight as a result. Low trade count means each individual result has a large impact on the overall return figure, and a single large losing trade dominates the total return calculation.
The Sharpe Ratio of -0.04 sits just below zero. That is almost neutral on a risk-adjusted basis, but slightly negative, meaning the strategy absorbed volatility without compensating for it in return. It is not the deeply negative Sharpe seen in momentum strategies during trending periods, but it confirms the strategy did not earn its risk.
For context, a Sharpe above 1.0 is generally considered acceptable in traditional finance; above 2.0 is strong. Most retail strategies in crypto backtests sit between -0.5 and +0.5 on a 12-to-18 month window. A Sharpe of -0.04 in this environment suggests the strategy is essentially break-even on a risk-adjusted basis, with execution costs and position sizing being the marginal factors that pushed it below zero.
The Profit Factor of 0.72 defines the imbalance precisely: for every $1.00 lost across all trades, the strategy generated $0.72 in gross profit. The average trade result of -$180.03 across six positions drove the full period loss. A Profit Factor below 1.0 means the strategy loses money in aggregate.
A value of 0.72 is not extreme: it sits closer to 1.0 than to zero, which is consistent with the near-neutral Sharpe reading. The two metrics together suggest a strategy that is structurally marginal: producing some winning trades, but not enough positive expectancy to overcome losses. The RSI entry filter is doing partial work, but the overall configuration needs adjustment to cross into positive territory.
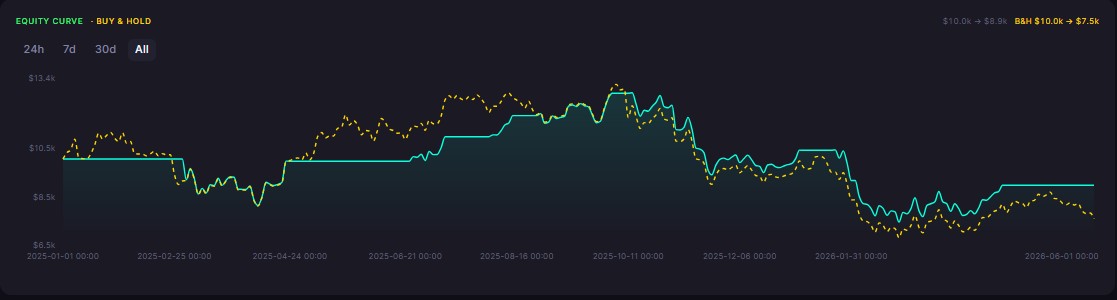
The -42.72% max drawdown is the most important number for a DCA bot user. It means at one point the open positions were sitting 42.72% below peak equity. DCA strategies are designed to hold through drawdowns on the assumption that the asset recovers. This backtest confirms that assumption, but also shows the patience required, and the capital at risk while waiting.
The January 2025 to June 2026 backtest window included significant Bitcoin volatility following the 2024 halving cycle, with sharp rallies and corrections that left daily RSI strategies holding positions through extended drawdown periods before reaching exit levels. Understanding what market conditions drove the drawdown is as important as the number itself.
There are several parameter adjustments worth testing against this baseline.
Tighten the exit: from RSI 65 to RSI 60 closes positions earlier in rallies, potentially reducing the risk of holding through a reversal at the cost of leaving some upside on the table.
Lower the entry threshold: from RSI 40 to RSI 35 makes entries more selective, filtering for deeper dips before triggering: this reduces trade count further but biases entry prices lower.
Add a trend filter: for example, only entering when the 50-day moving average is rising, to avoid RSI dip entries during sustained bear phases, which is likely where the significant drawdown in this backtest originated.
None of these adjustments are guaranteed improvements; each should be backtested independently before deployment.
Three Things to Know Before Running a DCA Bot
DCA reduces average entry price, not loss. If an asset trends down for an extended period, a DCA bot continues accumulating a declining asset. Set a maximum drawdown limit before deployment. A trailing stop or a maximum open loss threshold is the most direct way to cap this exposure; without one, the strategy is implicitly betting on recovery regardless of how far the asset falls. The -42.72% drawdown in this backtest illustrates the point: the strategy held through a deep correction waiting for the RSI exit signal.
Indicator-triggered DCA is smarter than time-based, but not guaranteed. The RSI filter improves entry timing compared to fixed-interval buying, but as the backtest shows, it does not eliminate losing trades or a negative Profit Factor. The filter is a signal of relative weakness, not a prediction of recovery. Bitcoin can remain in RSI sub-40 territory for extended periods during bear cycles, and the RSI cross-back-above-40 entry will still trigger even if the broader trend is declining.
Backtesting the exact strategy before going live is essential. The 18-month results here show a specific outcome on a specific configuration. Changing the RSI thresholds or the timeframe changes the result. Test before you deploy. A 4-hour timeframe, for instance, would generate significantly more trades than the daily version, which changes every metric (win rate, profit factor, drawdown, and total return) even with identical entry and exit logic. The backtest is the only way to see the actual shape of a configuration before committing real capital.
Set up and backtest your DCA strategy on CoinQuant before going live. Start free on CoinQuant
Disclaimer:
This content is for educational and informational purposes only and does not constitute financial, investment, or trading advice. All strategies and examples are for illustrative purposes and do not guarantee results. Always conduct your own research before making financial decisions.
Key Takeaway