
What is backtesting software and how does it work? Why one trade can show $200 or $119
The fill and cost assumptions behind a backtest, explained with one hypothetical trade.
Backtesting software replays a trading strategy's exact rules on historical market data and records what each trade would have done: when it would have filled, what it would have cost and how the account would have moved. Two tests of the same signals can report very different numbers, depending on the fill and cost assumptions underneath them. In the hypothetical trade below, identical entry and exit signals show a $200 profit in an idealized test and $119.27 in a cost-aware one.
Short answer: Backtesting software takes your rules, loads historical data, checks the rules bar by bar (or tick by tick), simulates fills, applies fees and slippage, and reports metrics, an equity curve and a trade log. The result is evidence about the past under stated assumptions. Reading it well means knowing which assumptions produced the number, and how much of the result would survive realistic fills and costs.
What is backtesting software and how does it work?
You give the software rules precise enough for a machine to follow. For example: "Enter long when the 20-period average crosses above the 50-period average on the 4-hour chart, exit on the opposite cross, and use 10% of capital per trade." A correctly configured test walks through history in time order, uses only information available at each moment, and simulates the rules. The engine and input data still need checking for leakage.
Almost every engine, from a Python library to a no-code builder, runs some version of five stages:
| Stage | What happens | The question to ask |
|---|---|---|
| 1. Rules | Your strategy becomes exact conditions, sizing and exits | Can I read back the exact logic that was tested? |
| 2. Data | Historical prices load for the instrument and timeframe | Is the source named, and is the coverage shown? |
| 3. Signals | The rules are checked at each bar or tick, in time order | Is a signal confirmed at the bar close or inside the bar? |
| 4. Fills | The engine decides the price and time of each fill | Where does the fill happen after a signal on bar N? |
| 5. Costs and reporting | Fees and slippage are applied, and trades become metrics | Are costs included in every run, and can I see every trade? |
For a stage-by-stage tour with the feature that protects each step, see our six-step backtesting pipeline guide. This guide concentrates on stages 4 and 5, because that is where the same strategy turns into different numbers, and on how to read a result with that in mind.
Fill timing: the assumption hiding in every result
A signal calculated from a candle's close usually cannot be traded at that same close. By the time the close is known, the market has moved on to the next bar.
Well-documented engines say which convention they use. Backtrader's documentation explains that a market order fills at the opening price of the next bar, because "the next price spot that will happen is the upcoming open price." If a strategy needs the completed close to create its signal, filling at that same close can introduce lookahead. Same-close execution is not automatically wrong under every model, but any exception needs a defensible order-timing convention rather than access to a close that was not yet known.
A second assumption sits inside each candle. A candle records only the open, high, low and close, not the order in which prices happened. If a stop loss and a take profit both fall inside one candle's range, the engine has to assume which one was hit first. Different tools resolve this differently, and some use finer data to decide.
Neither problem makes backtesting useless. You just need to know the answers for your tool. Ask: "When my signal fires on bar N, at what price and time does the fill happen, and how are stops and targets inside one candle resolved?" If the documentation does not say, open the trade log and compare the timestamps and prices with the chart.
Costs: one hypothetical trade, two results
The example below is hypothetical and untested. It uses round numbers to show the mechanics, not the behavior of any real asset, strategy or trading venue.
Assumptions: $10,000 of notional is used to buy at entry. Fees are 0.10% of notional on each side and are paid on top of the $10,000. Slippage is 0.05% per fill. The entry signal fires at a candle close of 100.00, and the exit signal fires at a later close of 102.00. In the cost-aware column, the next bar opens at 100.30 after the entry signal and at 101.80 after the exit signal. Those opens are illustrative: in reality the next open can be better or worse than the signal close. Calculations keep full precision; only the displayed figures are rounded.
| Step | Idealized test: fills at the signal close, no costs | Cost-aware test: next-bar fills, costs applied |
|---|---|---|
| Entry fill | 100.00 | 100.30 plus 0.05% slippage = 100.35015 |
| Units bought with $10,000 | 100.00000 | 99.65107 |
| Exit fill | 102.00 | 101.80 minus 0.05% slippage = 101.74910 |
| Exit proceeds | $10,200.00 | $10,139.41 |
| Gross profit | $200.00 | $139.41 |
| Fees (0.10% of entry and exit notional) | $0.00 | $10.00 + $10.14 = $20.14 |
| Net profit | $200.00 | $119.27 |
What changed, and by how much
The two effects can be separated:
- Costs only (fills still at the signal close): $169.62, about 15% less than the idealized result.
- Next-bar fills only (no costs): $149.55, about 25% less.
- Both together: $119.27, about 40% less.
In this example, the fill assumption moved the result more than the fees did. That depends entirely on the assumed opens, so do not read it as a rule. The point is that the headline number comes from the assumptions as much as from the strategy.
If you want to see costs change a real result, our trading fees test runs one Bitcoin strategy at 0%, 0.1% and 0.2% fees.
A cost-aware worksheet for reading any backtest
Use this worksheet on any result, from any tool, before you trust the return. The example figures continue the hypothetical trade above.
Cost-aware backtest worksheet
1. Round-trip cost. (Fee per side × 2) + (slippage per fill × 2). Example: (0.10% × 2) + (0.05% × 2) = 0.30% of the position.
2. Average gross result per trade. Total gross profit ÷ number of trades, as a percentage of the position size.
3. Edge after costs. Step 2 minus step 1. Example: a strategy that averages 0.25% gross per trade has an edge of minus 0.05% after 0.30% round-trip costs, before any other risk.
4. Yearly cost drag. Round trips per year × position size × round-trip cost. Example: 100 × $10,000 × 0.30% = $3,000 a year.
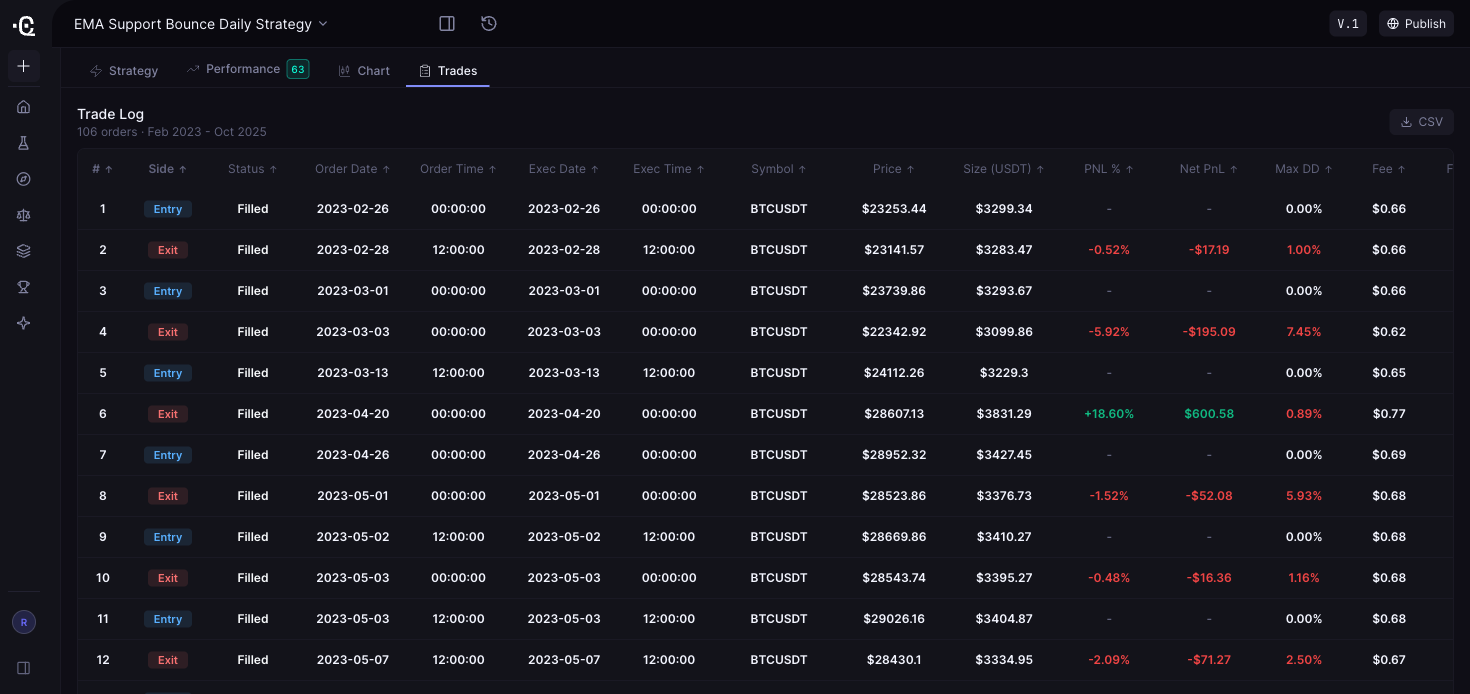
5. Fill check. Open five trades in the trade log. Does each entry come after the signal bar, at a price that existed at that time?
6. Same-candle check. Find a trade where the stop and the target both sat inside one candle. Which one did the engine use?
7. Sensitivity. If your tool lets you change cost settings, re-run with higher costs, such as double the slippage. If the result flips from profit to loss, treat the strategy as fragile.
Steps 1 to 4 need only the summary and your cost assumptions. Steps 5 to 7 need a trade log and a tool that shows its settings, which is one reason those features matter more than the headline return. Treat steps 1 to 4 as approximate fixed-notional calculations: varying position sizes, changing exit values and compounded equity require trade-by-trade cost accounting.
Candles vs ticks: what data resolution can and cannot tell you
Candle (OHLCV) data summarizes the trades in a period in five values: open, high, low, close and volume. It is fast, compact and enough for most indicator strategies on hourly or daily charts. Trade-tick data records individual trades, so the engine sees the actual sequence of prices. That matters most for scalping, tight stops and strategies where several orders can trigger inside one candle.
Trade-tick data has limits too. A record of trades shows prices at which someone traded, not necessarily the bid and ask you would have faced, order-book depth or your place in the queue. Some tick feeds also carry quotes, so check what the actual dataset contains. Finer data improves the sequence of events; it does not guarantee your order would have filled.
Check limits per run as well. CoinQuant's pricing page lists up to 500,000 bars per backtest. Translated into calendar time, 500,000 one-minute candles is about 347 days of continuous crypto data, 15-minute candles cover about 14 years, and hourly candles about 57 years. On longer timeframes, the history available for an instrument usually runs out before a cap like that does.
The metrics, read with costs in mind
| Metric | What it tells you | What it can hide |
|---|---|---|
| Net return after costs | Profit after fees and slippage over the test window | Path, risk and luck. Two strategies with the same return can feel very different to hold. |
| Fees paid | How much of the gross result went to costs | Slippage, which some tools build into fill prices instead of reporting it separately |
| Maximum drawdown | The worst peak-to-trough fall | How long recovery took and how often deep falls happened |
| Trade count | How much evidence the result rests on | Whether trades cluster in one market regime |
| Profit factor | Gross wins divided by gross losses | Dependence on a few outlier trades |
| Win rate | Share of trades that made money | Payoff size. A high win rate can still lose money after costs. |
| Sharpe ratio | Excess return over the chosen risk-free rate per unit of return volatility | Its dependence on the measurement period. William Sharpe notes it "is not independent of the time period over which it is measured" (Sharpe, Stanford). |
| Buy-and-hold comparison | Whether the rules beat simply holding the asset | Risk differences if the strategy sat out of the market for long stretches |
| Composite score | A quick summary across several metrics | Everything above, if read alone |
A useful reading order: trade count first, then net return against buy and hold, then drawdown, then fees against net return, and only then the composite score. CoinQuant's documented results include PnL, win rate, profit factor, total trades, equity and drawdown charts, Sharpe ratio, volatility, maximum drawdown, fees, streaks and a trade log, plus a buy-and-hold line and a strategy quality score (SQS) from 0 to 100. Like every metric here, the SQS describes the test window. It is not evidence of future returns.
Three ways a clean-looking backtest still misleads
Overfitting. The more rule variations and parameter settings you try on the same data, the more likely it is that the best one looks good by chance. Bailey, Borwein, López de Prado and Zhu write that statistical techniques designed to prevent regression overfitting, "such as hold-out, tend to be unreliable and inaccurate in the context of investment backtests" (The Probability of Backtest Overfitting). Practical defenses: keep rules simple, change one thing at a time, prefer settings that work across a range, and record how many variations you tried. Our guide on optimizing without overfitting goes further.
Leakage (lookahead bias). Leakage means using information that was not available when the decision was made. Market data vendor Algoseek describes look-ahead bias as using information "that was not knowable on the date of the signal" (Algoseek). Common forms include filling at the close that generated the signal and reading a higher-timeframe candle before it has closed.
Survivorship bias. Algoseek describes the distortion that comes from testing only instruments that still exist today, which "inflates historical returns and understates drawdowns." In crypto, tokens that collapsed or were delisted rarely appear on a platform's current pair list. A strategy that worked on today's major pairs has not been shown to work on crypto in general.
Different problems need different safeguards. Unseen data helps assess overfitting: build on one period, freeze the rules, then test once on a later period without using its results to retune the strategy. It does not fix leaked future information or a survivor-only asset universe. For leakage, use point-in-time inputs and defensible signal-to-fill timing. For survivorship bias, use a historical universe that includes delisted or failed instruments where relevant. Walk-forward testing repeats optimization and forward validation across rolling windows. AmiBroker's guide describes verifying performance "by testing it forward in time on data following the optimization segment." In CoinQuant's app, re-run a frozen strategy version on a new date range; a built-in app walk-forward report is not described in the public docs. The Public API Skills Pack lists walk-forward and Monte Carlo analysis among advanced robustness skills for API users.
What are the top features to look for in backtesting software?
Look first for the features that make fills and costs visible, because they decide whether a result can be checked:
- Fees and slippage included in every run, with settings you can see.
- A documented fill convention, or a timestamped trade log that shows it.
- A full trade log with export, so you can audit any trade.
- A buy-and-hold benchmark next to the equity curve.
- Strategy versioning, so you can re-run unchanged rules on new dates.
- Named data with visible coverage, at a resolution that fits your strategy.
Our 2026 backtesting software evaluation checklist covers the full feature list, including pricing, limits and interfaces. Here is what CoinQuant documents for the features above, as checked on October 8, 2026:
| Feature | What CoinQuant documents | What to check yourself |
|---|---|---|
| Cost modeling | Trading fees are modeled in each backtest, and maker and taker fees can be set per order (changelog, January 26, 2026). | Default fee and slippage values, and whether you can set your own slippage rate, are not stated publicly |
| Fill convention | Not stated in the public docs | Compare trade-log timestamps and prices with the chart |
| Trade log and export | A timestamped trade log, and Download Data exports metrics and trade logs (FAQ) | Open five trades and check them |
| Benchmark | A buy-and-hold line next to the equity curve (changelog, April 27, 2026) | Compare drawdowns as well as returns |
| Versioning | Strategy versioning (how-to guide) | Freeze a version before the out-of-sample run |
| Data | Supported Assets lists 13,151 instruments across six asset classes, including 48 crypto pairs covering 21 crypto assets. Candle and tick data modes. | History depth for your instrument and timeframe |
Is backtesting software suitable for professional and quant use?
It depends on the part of the research process you need to cover. Quant teams often need custom fill and fee models, portfolio-level testing, code-level control and automated robustness studies, and code-first frameworks are built for that. QuantConnect's documentation, for example, describes reality models for fills, slippage, fees and brokerage that developers can customize per security (QuantConnect reality modeling). The trade-off is development time and responsibility for every modeling choice.
No-code tools trade some of that control for speed and standardized cost handling. Some researchers use both: a fast tool to screen ideas and a code-level engine for the survivors. Choose by the questions you need answered, not by labels like "retail" or "institutional."
Where CoinQuant fits
CoinQuant is a no-code AI strategy builder and backtester. You describe a strategy in plain English, the AI generates a structured strategy that you review and adjust, and CoinQuant backtests it on historical data, with trading fees modeled in each run. A Public API gives programmatic access to strategy generation, backtesting, optimization and research workflows. This article covers CoinQuant's research and backtesting features.
As listed on the pricing page on October 8, 2026, Pro costs $39.99 a month billed monthly, $399 billed yearly (about $33.25 a month) or $12.99 a week. The higher-priced plan costs $220 a month, $1,999 billed yearly (about $166.58 a month) or $69.99 a week. Plans include credits, and different actions use different amounts of credits.
Limits to know:
- The bar-level fill convention, same-candle stop and target handling and default cost values are not stated in the public docs. Check them in the trade log.
- Out-of-sample testing in the app means re-running a saved version on a new date range. A built-in walk-forward report is not described in the app documentation.
- A good backtest, including a high SQS, does not predict future returns. The gaps between backtest and live results still apply.
FAQ
What is backtesting software and how does it work?
Backtesting software simulates a trading strategy on historical market data. It loads prices, checks your rules at each bar or tick in time order, simulates when and at what price each order would have filled, applies fees and slippage, and reports metrics, an equity curve and a trade log. The result shows how the rules would have behaved under the stated assumptions, not how they will behave in the future.
What are the top features to look for in backtesting software?
Start with the features that make a result checkable: fees and slippage in every run, a documented fill convention or a trade log that shows it, a full trade log with export, a buy-and-hold benchmark, strategy versioning, and named data with visible coverage. Then compare limits, pricing and interface.
Is a profitable backtest proof that a strategy works?
No. It is evidence about the past under specific assumptions. Fill timing, costs, overfitting, lookahead bias, survivorship bias and changing markets can all make a backtest look better than live trading will be. US rules for commodity trading advisors recognize this: simulated results must carry a statement that they "do not represent actual trading" and are "designed with the benefit of hindsight" (17 CFR 4.41).
Do I need tick data for backtesting?
Only if your strategy depends on what happens inside a candle, such as scalping, very tight stops or several orders that can trigger in one bar. For most strategies on hourly or daily charts, good candle data is enough. Trade-tick data records executed trades, not necessarily the bid, ask or liquidity you would have faced. Some tick feeds include quotes, but quotes do not guarantee executable liquidity or that your order would have filled.
Conclusion: the practical lesson
A backtest is a simulation whose result depends on data, fills and costs. Calculate the round-trip cost, inspect individual fills, compare risk as well as return, and validate frozen rules on unseen data. A strong headline is a reason to investigate, not a promise of live performance.
- Backtesting software is a simulator, and every result depends on its fill and cost assumptions.
- In the hypothetical example, the same signals showed $200 idealized and $119.27 cost-aware, about 40% less.
- Work out the round-trip cost before you judge the return. For a fixed notional position, an average gross edge below the modeled round-trip cost is a loss after those costs.
- Check five trades in the log against the chart. The log shows the implemented rules when the docs do not.
- Freeze the rules and run them once on data they have never seen.
Work out your strategy's round-trip cost before you trust its return. Run the worksheet above on your rules, then backtest them on CoinQuant, check the fee and slippage settings in your run, and check five trades in the log against the chart.
Start your backtest on CoinQuant (https://app.coinquant.ai/)
Related reading
- How backtesting software works: the 6-step pipeline and the feature that protects each step (https://www.coinquant.ai/blog/how-backtesting-software-works-the-6-step-pipeline-and-the-feature-that-protects-each-step)
- Trading fees impact on returns: one Bitcoin strategy backtested at 0%, 0.1% and 0.2% fees (https://www.coinquant.ai/blog/trading-fees-impact-crypto-strategy-backtest)
- What to look for in backtesting software: the 2026 evaluation checklist (https://www.coinquant.ai/blog/what-to-look-for-in-backtesting-software-the-2026-evaluation-checklist)
- Backtesting data quality: why fees, slippage and data mode decide whether results are real (https://www.coinquant.ai/blog/backtesting-data-quality-why-fees-slippage-and-data-mode-decide-whether-results-are-real)
- Why your backtested crypto strategy fails live (https://www.coinquant.ai/blog/why-your-backtested-crypto-strategy-fails-live-the-performance-gaps-most-traders-miss)
Disclaimer:
Key Takeaway