How-To Guides
1. Build a Strategy (From the Dashboard)
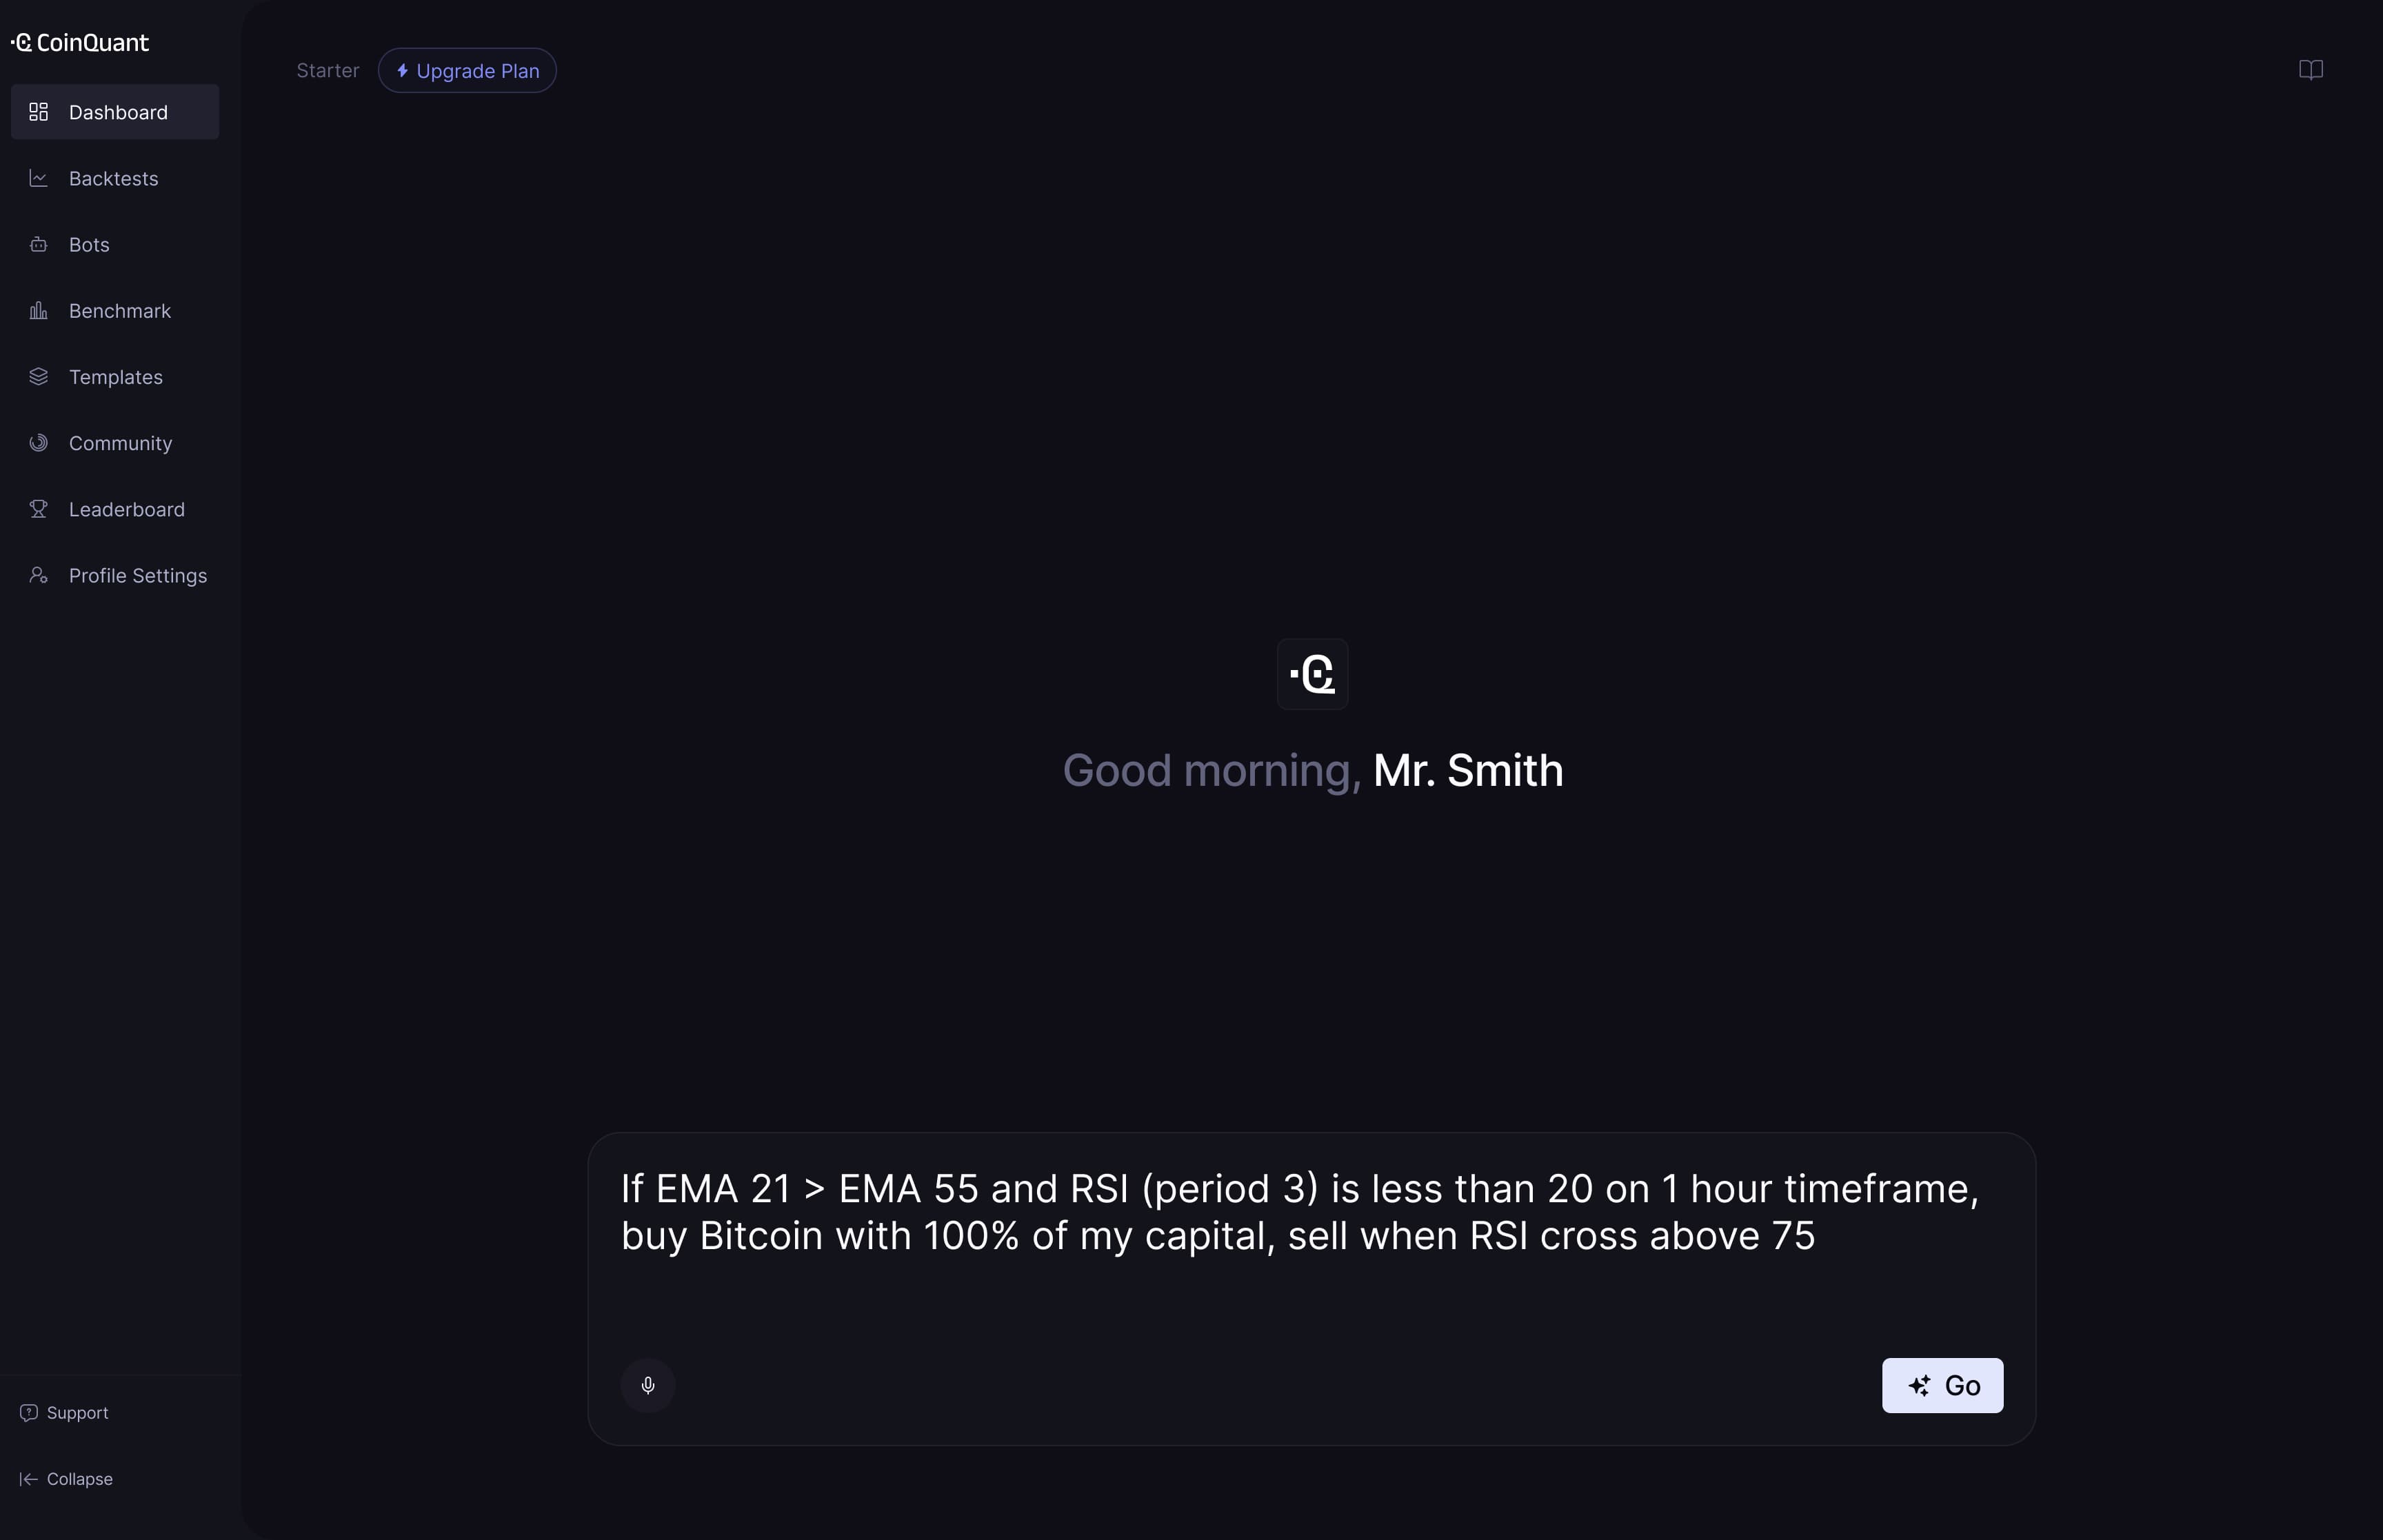
- Log in to your CoinQuant Dashboard.
- In the dashboard prompt box, type your strategy idea in plain English. Example: “If EMA 21> EMA 55 and RSI (period 3) is less than 20 on 1 hour timeframe, buy Bitcoin with 100% of my capital, sell when RSI cross above 75”
- Click Go to generate your strategy.
- CoinQuant’s AI automatically generates a structured strategy schema for you to review and adjust.
- Review and fine-tune the strategy visually in the builder.
You’re now ready to evaluate the strategy. When you’re satisfied with the logic, continue to Run Backtest in Step 2 to configure settings and test performance on historical data.
2. Run a Backtest
- In the Strategy Builder, click Run Backtest in the top-right corner.
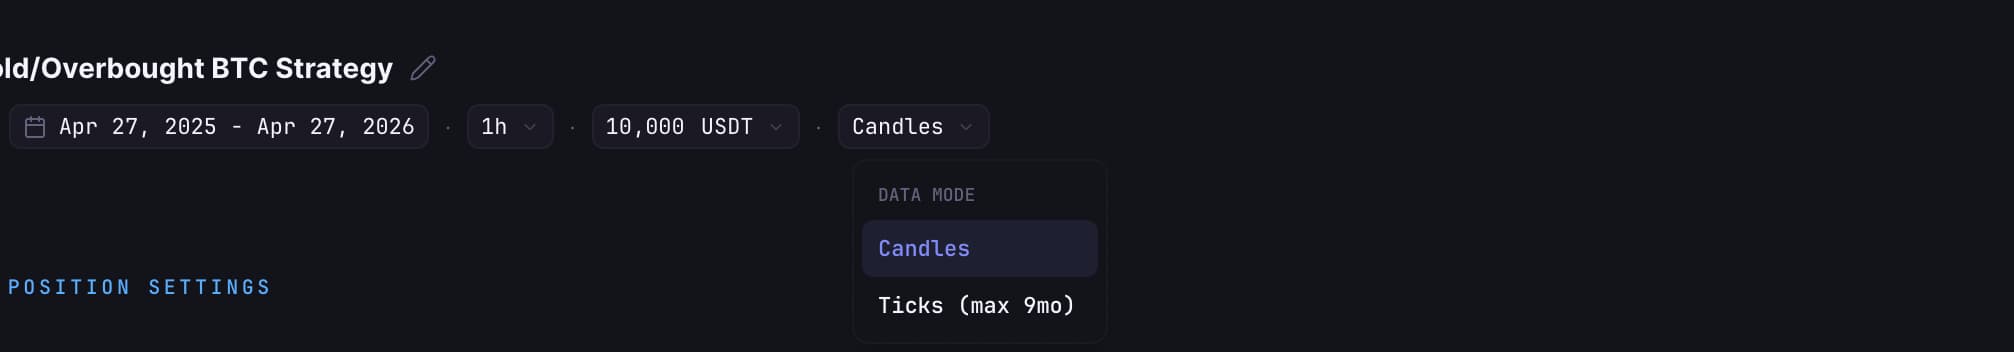
- Configure your backtest settings directly from the top bar:
- Date Range
- Initial Capital (e.g. 10,000 USDT)
- Instrument & Timeframe
- Select Data Mode (Candle or Tick-level)
- Adjust your position size within the strategy blocks (e.g. 100% of capital per trade).
- Click Run Backtest to start the simulation.

Results Overview
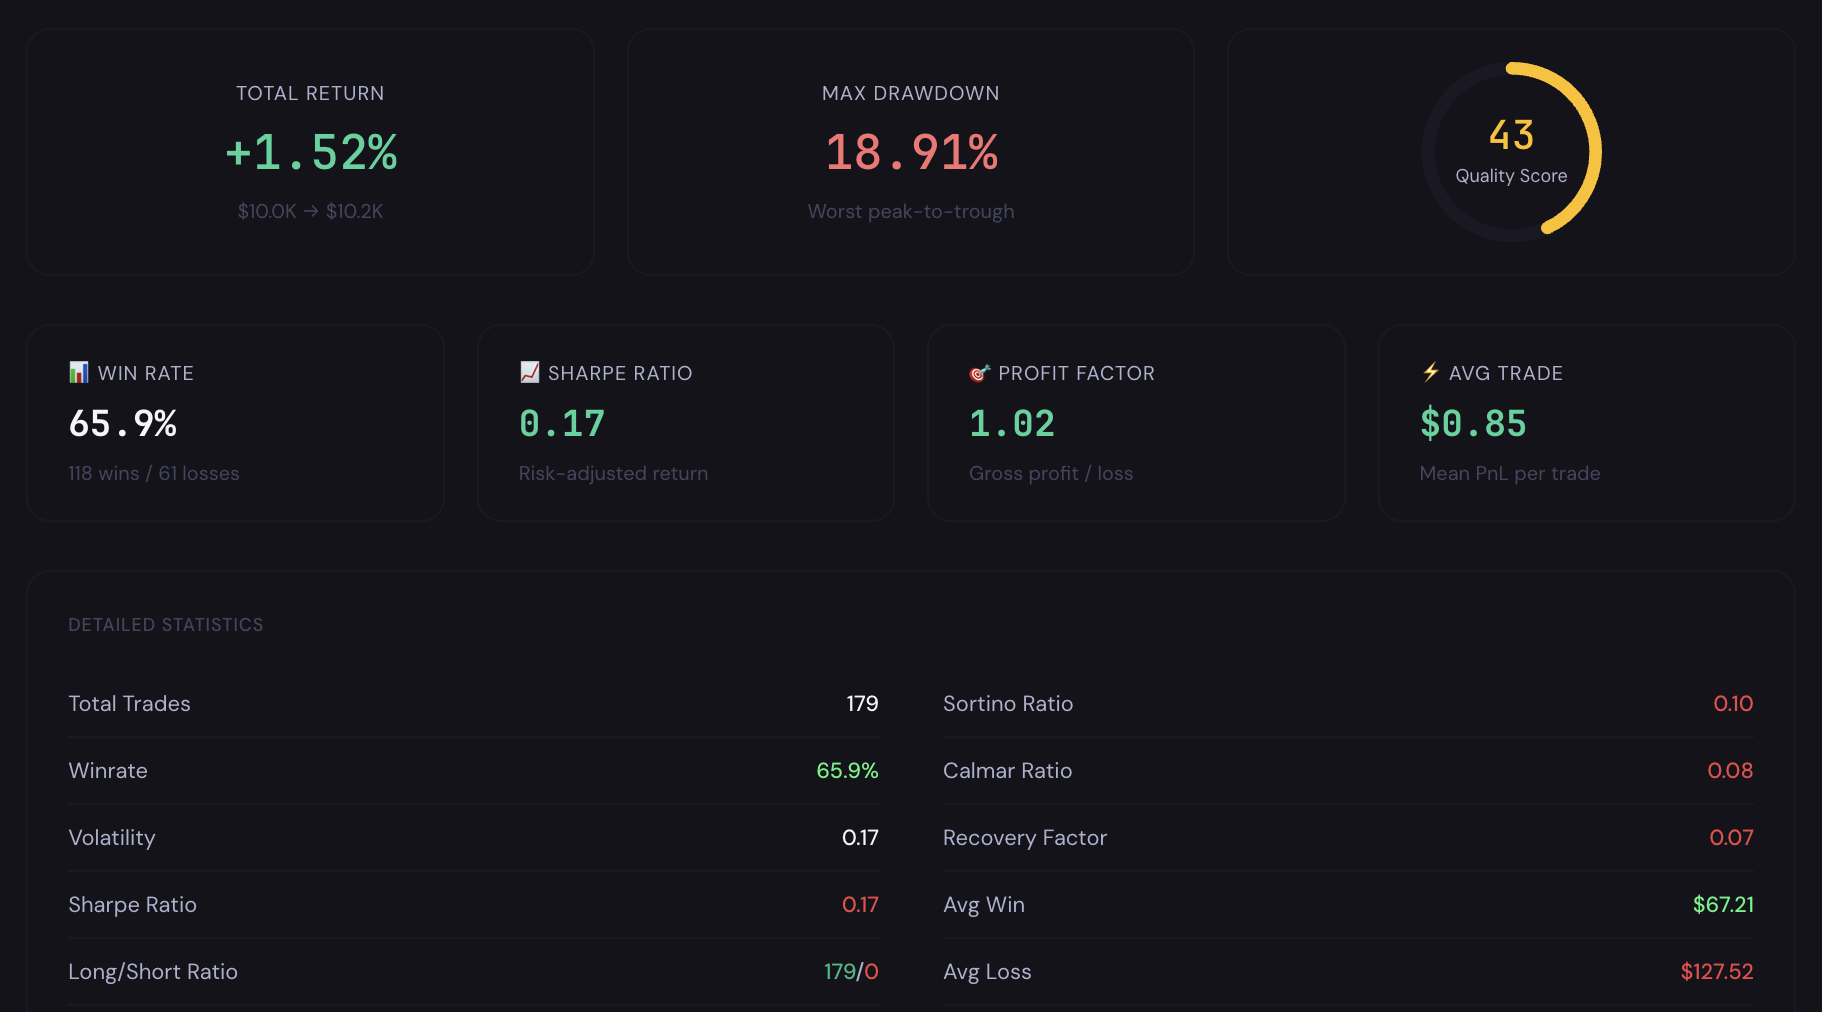
Once the backtest completes, review your performance:
- Summary: PnL, Win Rate, Profit Factor, Total Trades
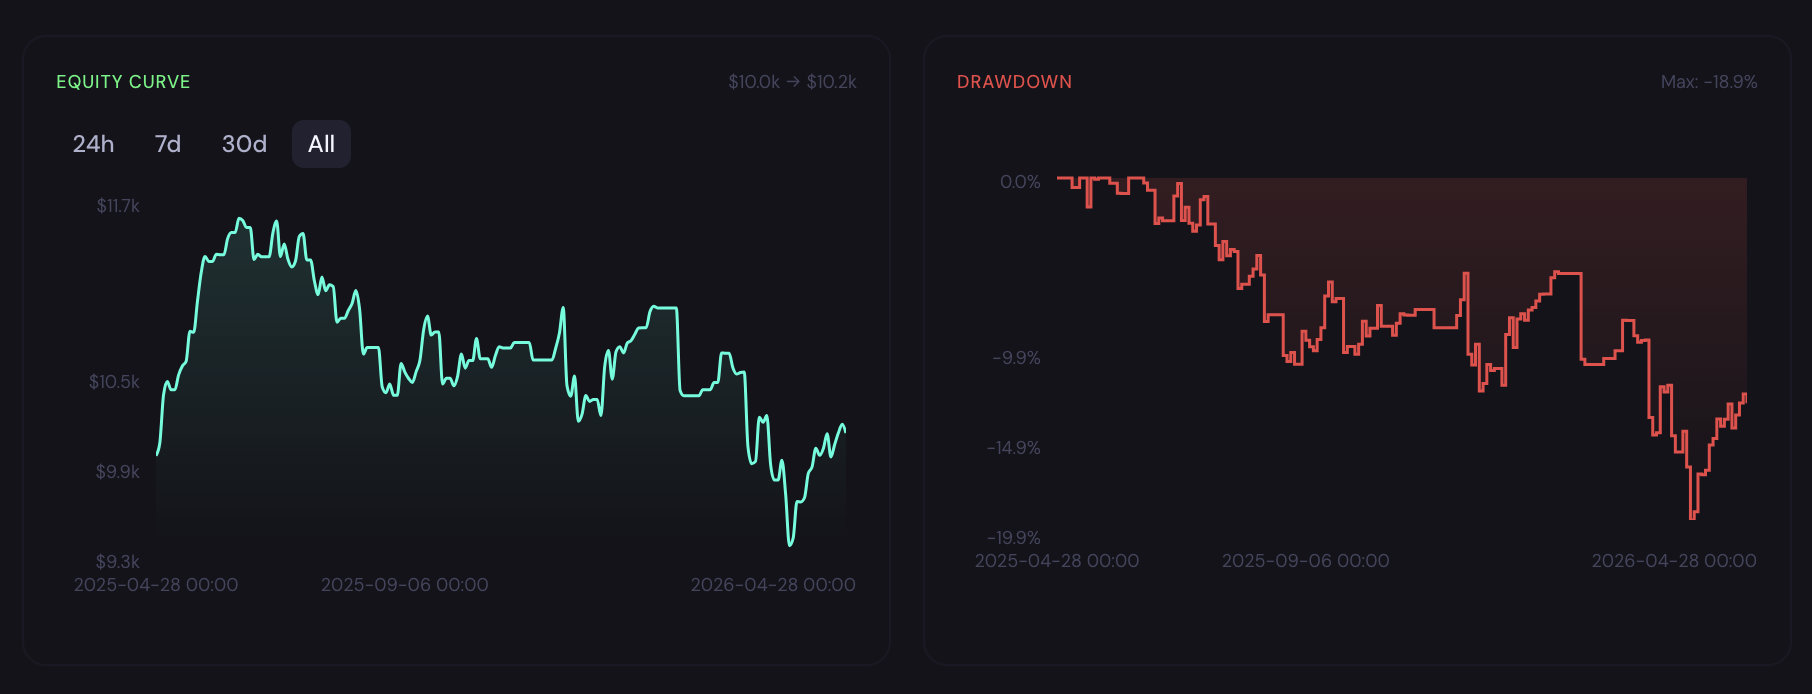
- Charts: Equity curve and drawdown over time
- Detailed Stats: Sharpe ratio, volatility, max drawdown, fees, streaks, and more
- Trade Log: Full list of executed trades with timestamps
Iterate & Improve
- Modify your rules directly in the visual strategy builder
- Re-run the backtest to compare performance
- Use versioning (e.g. v1) to track changes
💡 Backtesting helps you validate and refine your strategy before deploying real capital.
3. Analyze the Strategy
After running a backtest, you can continue refining your strategy by asking the domain expert for deeper analysis.
- Review your backtest results in the Strategy Builder.
- In the chat box below the strategy, ask follow-up questions about its performance.
- Use the insights to identify weaknesses and refine your strategy.
💡 Try asking the domain expert:
- What are the main weaknesses of this strategy based on the results?
- How can I improve the risk management of this strategy?
- In which market conditions does this strategy perform best or worst?
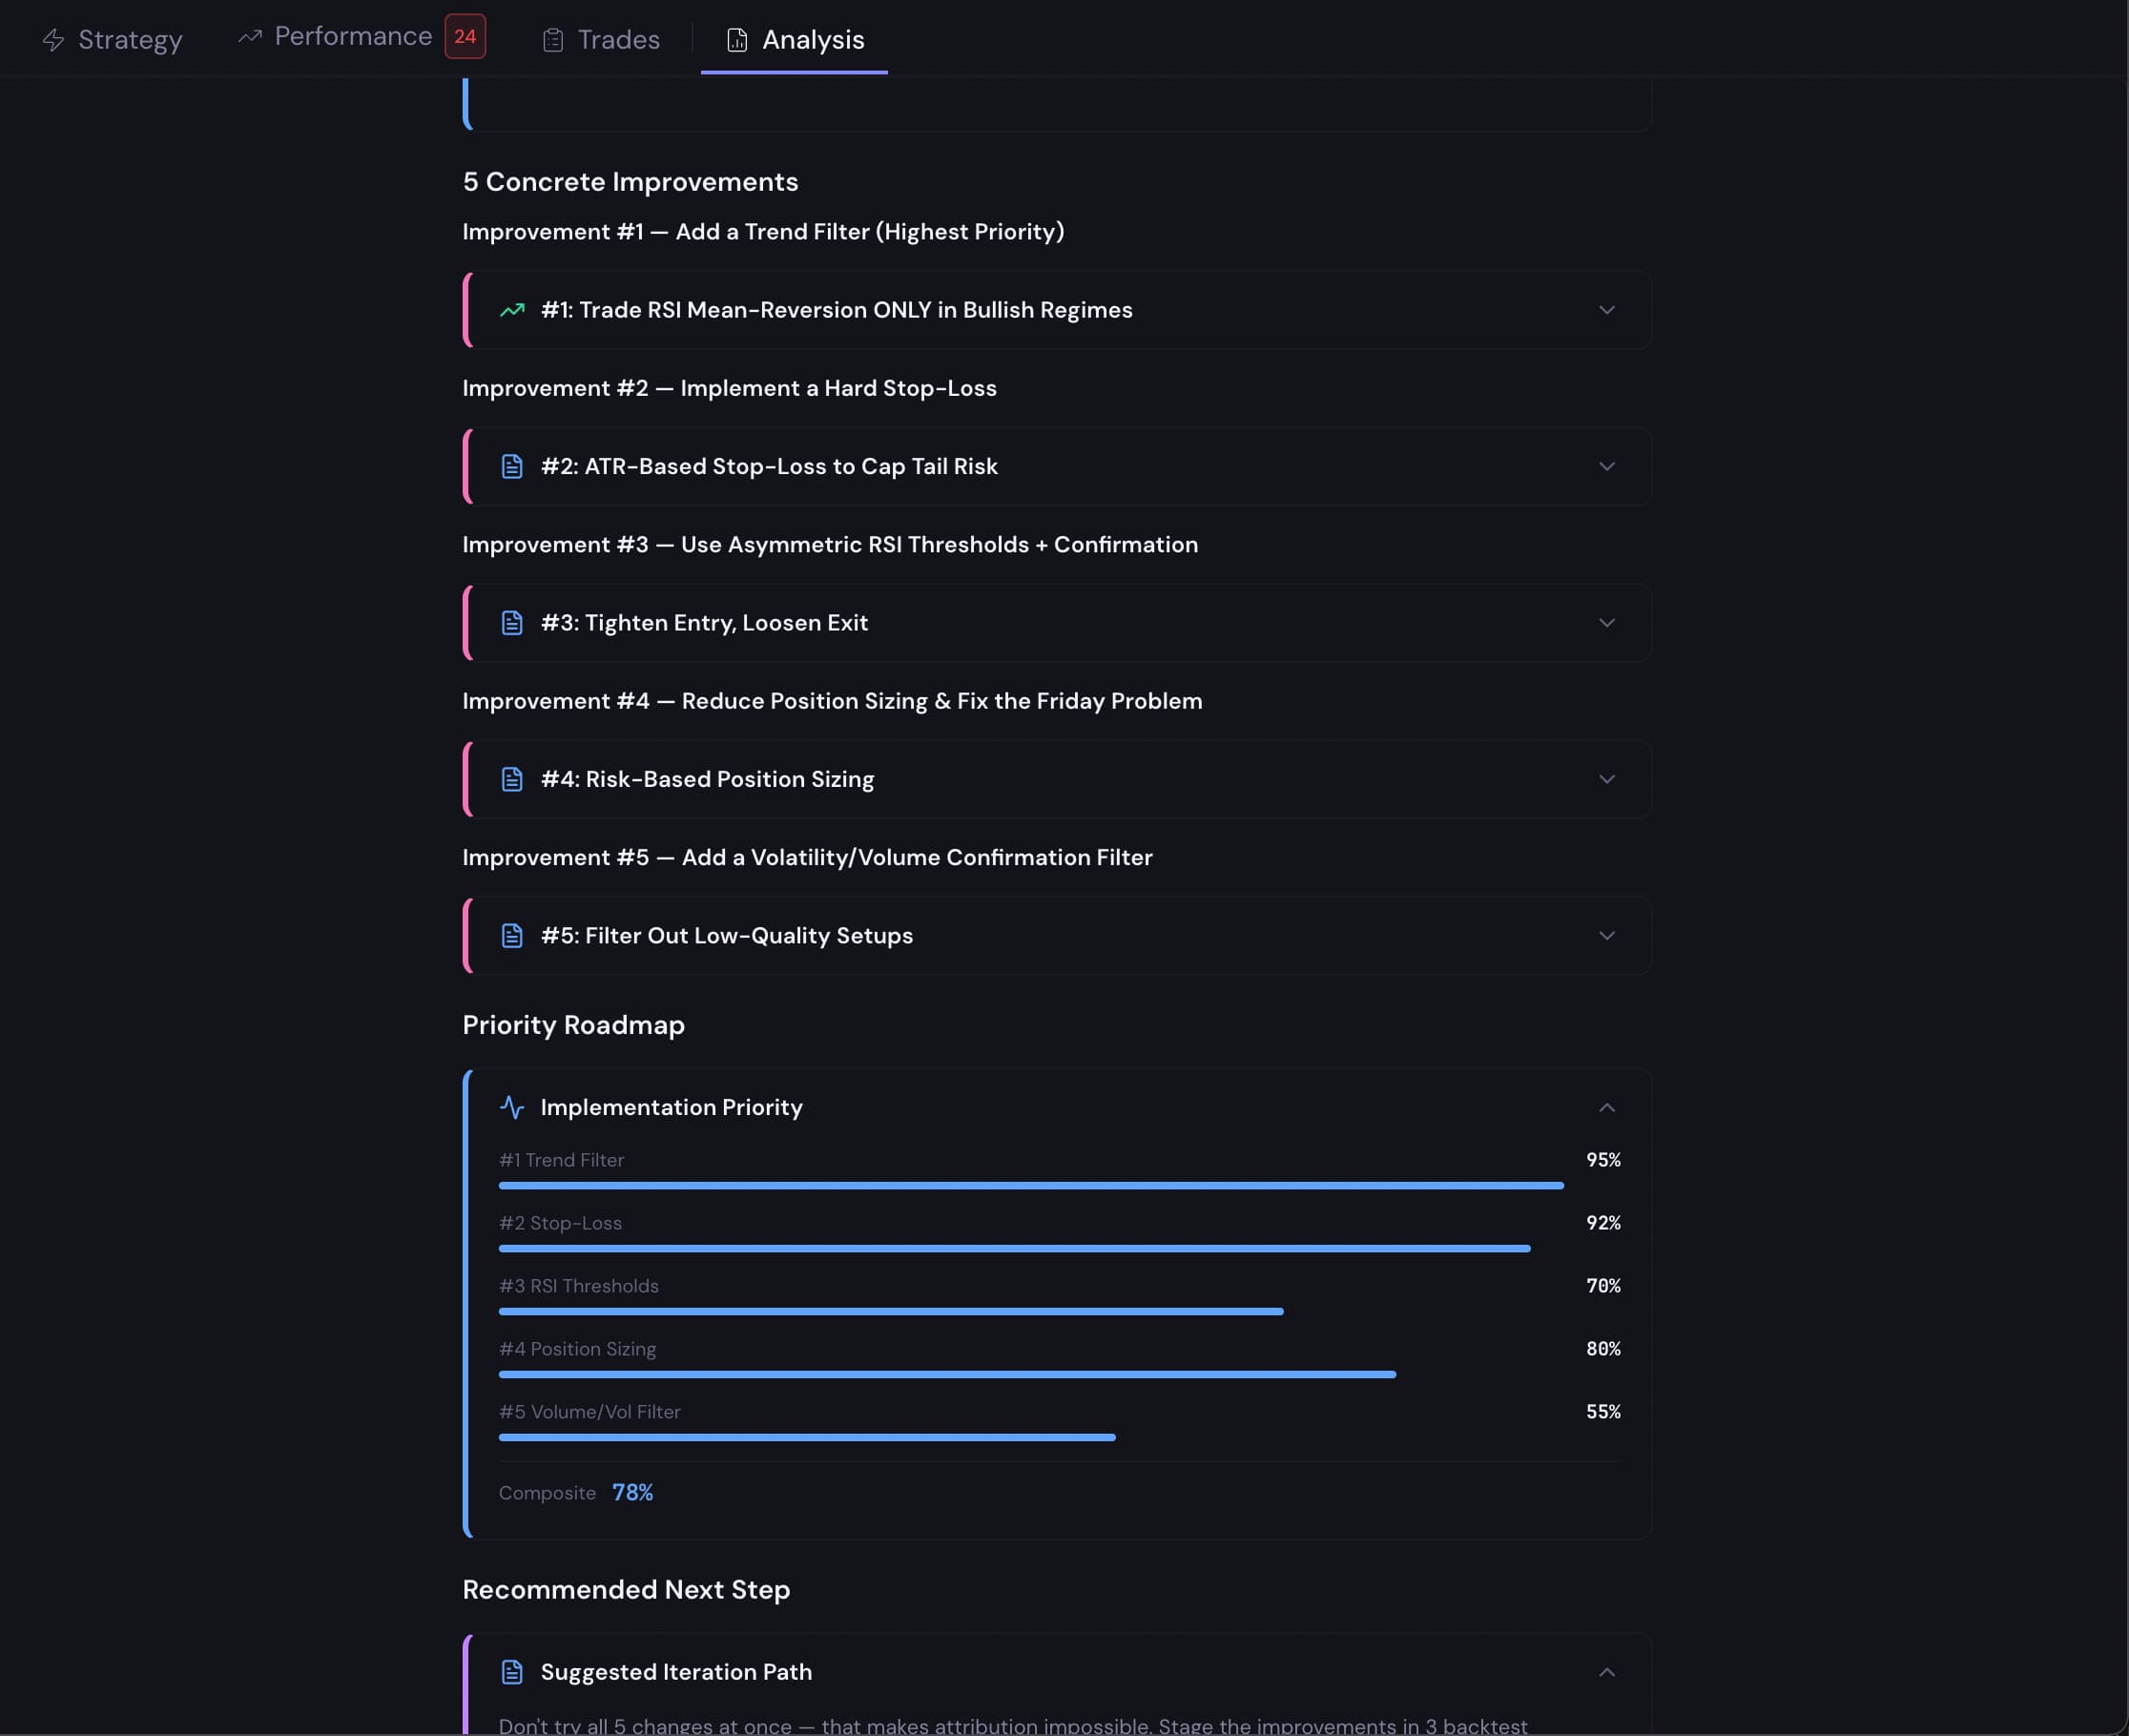
Example Output
CoinQuant will analyze your strategy and highlight weaknesses, for example:
- No trend filter: may trade against strong market moves
- No stop-loss: exposes you to large losses
- 100% position sizing: high risk per trade
It will also suggest improvements such as:
- Using crosses_above / crosses_below instead of static levels
- Adding a trend filter (e.g. 200 MA or Supertrend)
- Applying a stop-loss or trailing stop
- Reducing position size for better risk management
💡 Use these insights to refine your strategy, then re-run the backtest to measure improvements.
4. Use Strategy Templates
Templates are pre-built strategies you can use as a starting point and customize.
- Go to Templates from the left sidebar.
- Browse or search for a strategy (e.g. BTC 200 SMA Cross 1h).
- Click on a template to open it.
- The strategy will load directly into the Strategy Builder.
- Customize the logic or parameters, then click Run Backtest to test it.
💡 Templates are a great way to understand how different strategies are structured and quickly experiment with ideas.

5. Understand Data Mode (Candles vs Ticks)
Candles (Default)
- Uses OHLCV candles (Open, High, Low, Close, Volume)
- Available across multiple timeframes (e.g. 1m, 5m, 1h, 1d)
- Fast and efficient for backtesting
- Ideal for most indicator-based strategies (RSI, MACD, Moving Averages, Bollinger Bands)
Available for:
- All supported assets (crypto, stocks, ETFs, forex, commodities)
Ticks (Crypto Only)
- Uses individual trades (tick-level data)
- Provides more precise execution and realistic fills
- More computationally intensive than candles
Available for:
- Crypto instruments only
- Pro: up to ~10 days of tick data
- Elite: up to ~6 months of tick data
⚠️ Tick data is not available for stocks, ETFs, forex, or commodities.
How to Choose
- Select Candles for faster backtests and general strategy development
- Use Ticks when you need higher precision (e.g. scalping, tight stop-loss strategies)
💡 Tick backtests consume more credits due to the higher volume of data processed.
6. Upgrade or Manage Your Subscription
You can access your plan and credits from the Settings page.
How to Access
- Click your profile (bottom-left username) → opens Settings → Credits
- Or click Credits directly from the sidebar to open My Credits
Upgrade Your Plan
- Go to Settings → My Credits
- View your available credits and usage
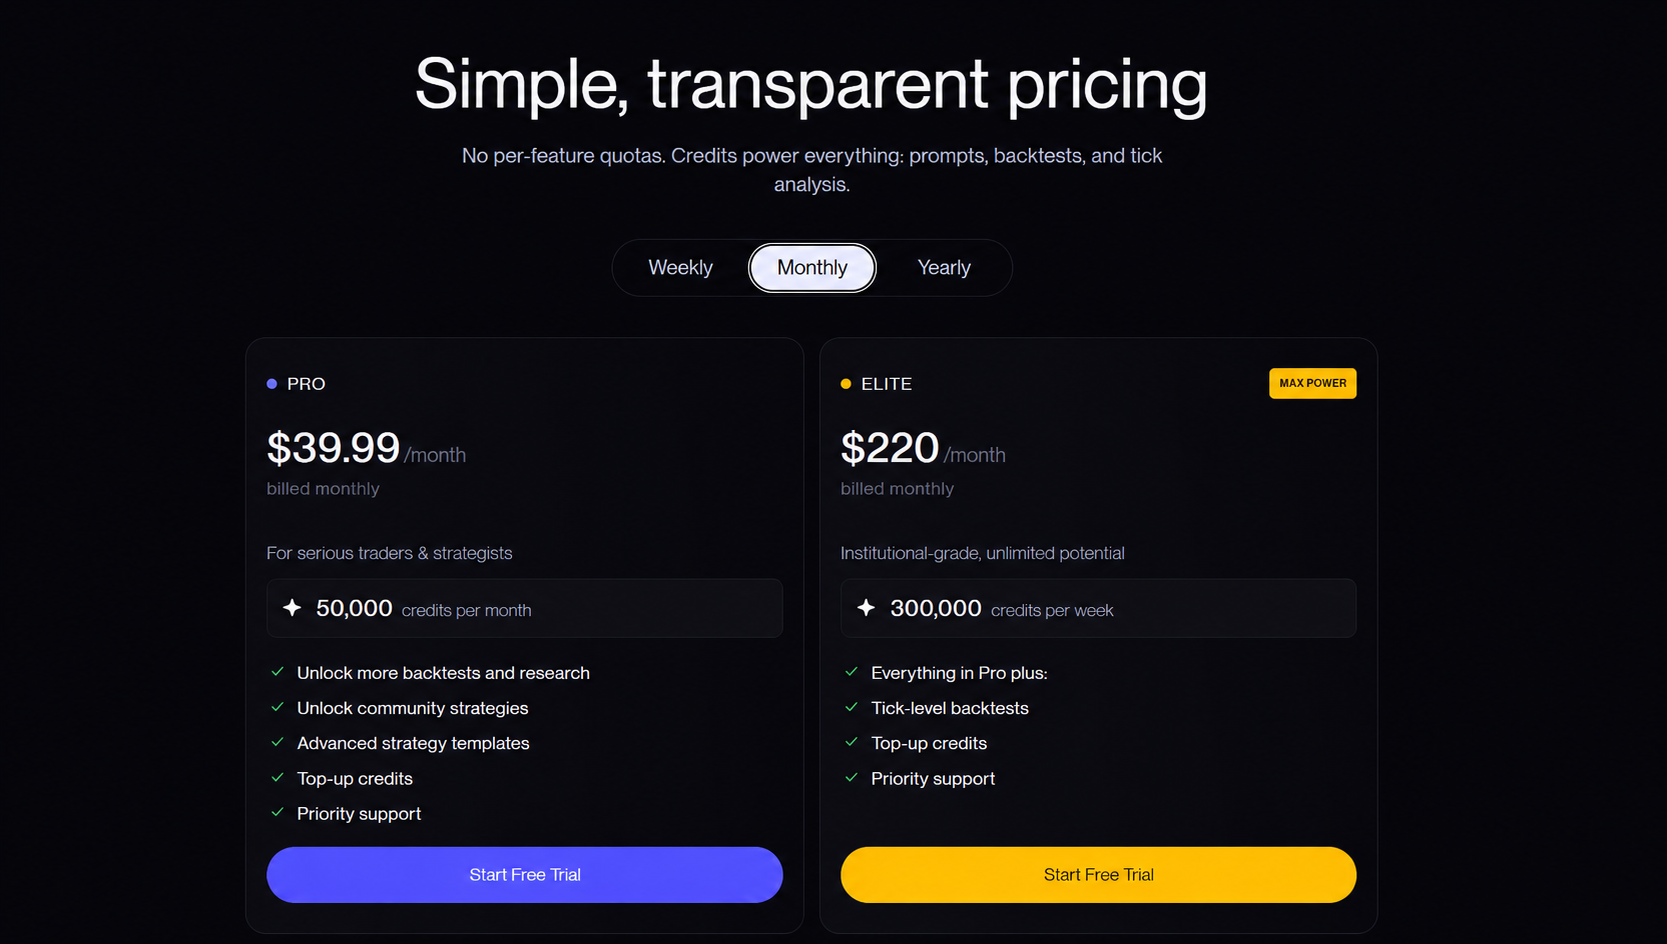
- Scroll down to explore plans:
- Free
- Pro
- Elite
4. Click Upgrade to Pro or Upgrade to Elite
Manage or Cancel Your Plan
- Go to Settings → Billing
- Update billing details or cancel your subscription
ℹ️ Your plan stays active until the end of your current billing cycle after cancellation.