
Trading Fees Impact on Returns: One Bitcoin Strategy Backtested at 0%, 0.1% and 0.2% Fees

The trading fees impact on returns is easy to underestimate because each fee looks tiny. In this test, one Bitcoin strategy with identical trades returned +54.78% with no fees, +26.47% at a 0.1% taker fee and +3.34% at 0.2%.
Same 101 trades, same entry and exit dates, same window from August 2021 to August 2026. The only thing that changed was the fee, and it took the result from close to buy and hold (+57.33%) to roughly flat.
This article shows where that money went and whether the strategy's thin edge survives each tested fee level. Every figure comes from three backtests with identical rules and window.
Trading Fees Impact on Returns: Why Trade Count Matters
A taker fee is charged on every fill, so a round trip pays it twice. A strategy's fee bill therefore grows with how often it trades, not with how long it holds.
The strategy here, BTC Chande Momentum Cross 1D, is one 101-trade strategy with a thin profit factor. It buys Bitcoin when the Chande Momentum Oscillator (CMO, period 20) crosses above zero and sells when it crosses back below. Over five years that meant 202 fills, each one charged at the tested fee rate.
Fees also compound. Every dollar paid is a dollar that is no longer in the next trade, so the gap between a fee-free and a fee-inclusive result ends up larger than the fees themselves.
That makes fee sensitivity a property of the strategy, not only of the exchange. At a 0.1% taker fee, each round trip costs 0.2% of the position, and a strategy that trades 101 times pays that bill 101 times.
Test Setup
| Parameter | Fee 0% | Fee 0.1% | Fee 0.2% |
|---|---|---|---|
| Strategy | BTC Chande Momentum Cross 1D (Fee 0%) | BTC Chande Momentum Cross 1D | BTC Chande Momentum Cross 1D (Fee 0.2%) |
| Taker fee per fill | 0% (maker 0%) | 0.1% | 0.2% |
| Entry | CMO(20) crosses above 0 | CMO(20) crosses above 0 | CMO(20) crosses above 0 |
| Exit | CMO(20) crosses below 0 | CMO(20) crosses below 0 | CMO(20) crosses below 0 |
| Instrument and data | BTCUSDT (spot, Binance), Kaiko via CoinQuant | BTCUSDT (spot, Binance), Kaiko via CoinQuant | BTCUSDT (spot, Binance), Kaiko via CoinQuant |
| Timeframe and window | Daily (1D), 2021-08-01 to 2026-08-01 | Daily (1D), 2021-08-01 to 2026-08-01 | Daily (1D), 2021-08-01 to 2026-08-01 |
| Capital and sizing | $10,000, 100% of equity per entry, long only, no leverage | $10,000, 100% of equity per entry, long only, no leverage | $10,000, 100% of equity per entry, long only, no leverage |
| Slippage | None set | None set | None set |
All three runs produced the same 101 trades on the same dates at the same prices, so any difference in the results comes from the fee alone. The three trade logs match fill for fill on entry date, exit date and price.
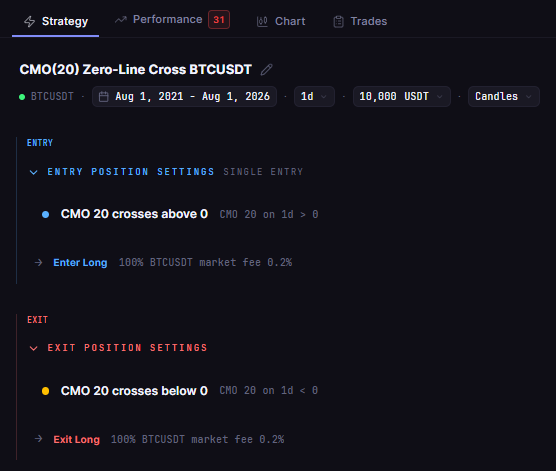
BTC Chande Momentum Cross 1D (Fee 0.2%) in the CoinQuant strategy builder: enter when CMO(20) crosses above 0 and exit when it crosses below 0, the same rules in all three fee runs.
Screenshot from the author's CoinQuant account. Backtest results are hypothetical, based on historical data with modelled fees, and do not guarantee future performance. Not financial advice.
Results at Three Fee Levels
| Metric | Fee 0% | Fee 0.1% | Fee 0.2% | BTC Spot Comparison |
|---|---|---|---|---|
| Strategy | BTC Chande Momentum Cross 1D (Fee 0%) | BTC Chande Momentum Cross 1D | BTC Chande Momentum Cross 1D (Fee 0.2%) | BTC Buy and Hold 1D 2021-2026 |
| Total Return | +54.78% | +26.47% | +3.34% | +57.33% |
| Final Balance | $15,478.50 | $12,647.40 | $10,334.12 | $15,733.43 |
| Total Fees | $0.00 | $2,309.19 | $4,117.75 | $25.74 |
| Total Trades | 101 | 101 | 101 | 1 |
| Win Rate | 31.68% (32W / 69L) | 29.70% (30W / 71L) | 28.71% (29W / 72L) | n/a (single hold) |
| Profit Factor | 1.20 | 1.10 | 1.01 | n/a |
| Sharpe Ratio | 0.43 | 0.31 | 0.19 | 0.44 |
| Max Drawdown | 55.73% | 57.95% | 60.28% | 76.63% |
| CAGR | +9.13% | +4.81% | +0.66% | +9.48% |
Each step up in fees cost more than 20 percentage points of total return: 28.31 points from 0% to 0.1% and 23.13 points from 0.1% to 0.2%. Over the same steps, the fee bill rose from $0.00 to $2,309.19 to $4,117.75.
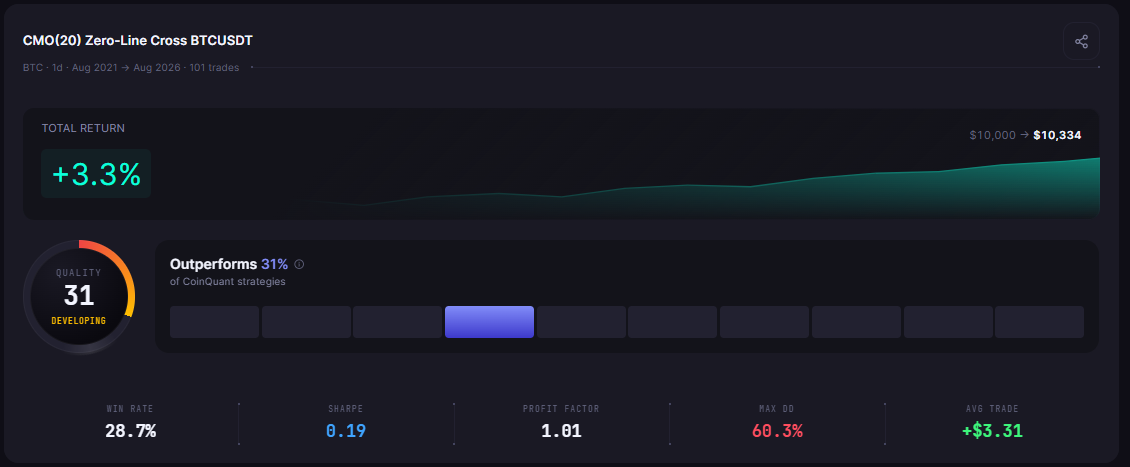
BTC Chande Momentum Cross 1D (Fee 0.2%): 101 trades finished at +3.34%, with a 60.28% max drawdown.
Screenshot from the author's CoinQuant account. Backtest results are hypothetical, based on historical data with modelled fees, and do not guarantee future performance. Not financial advice.
Does the Edge Survive Each Tested Fee Level?
At 0%: a real but modest edge
With no fees, the strategy made $1.20 of gross profit for every $1.00 of gross loss and finished at +54.78%. That is close to Bitcoin buy and hold (+57.33%) with a shallower 55.73% drawdown against 76.63%.
At 0.1%: the edge survives, thinner
The 0.1% run paid $2,309.19 in fees, yet it finished $2,831.10 below the zero-fee run. The difference is compounding: fees paid early shrink every later position. The profit factor fell to 1.10.
At 0.2%: the edge barely survives
At 0.2% the fee bill reached $4,117.75 and the profit factor fell to 1.01, which means gross profit covered gross loss by almost nothing. The result, +3.34% over five years, is effectively a flat line with a 60.28% drawdown on the way.
Fees also changed the win rate. Three trades that were small winners with no fees became losers at 0.2%, so winning trades fell from 32 to 29. On a strategy whose average win ($1,006.46 at 0%) is 2.60 times its average loss, those small flips matter.
Risk got worse as fees rose
Fees did not only lower the return. The maximum drawdown deepened from 55.73% to 57.95% to 60.28%, and the Sharpe ratio fell from 0.43 to 0.31 to 0.19. At 0% the strategy's Sharpe nearly matched Bitcoin buy and hold (0.44); at 0.2% it delivered less than half of that.
Fees vs Slippage
This test isolates the fee. It does not model slippage: the runs set no slippage, and the trade logs show zero slippage on all 202 fills of each run. As general guidance, real trading adds the spread and any price movement between signal and fill, and those costs compound the same way.
So the 0.1% row is not a worst case. If your real cost per fill is higher once spread and slippage are included, the 0.2% row is a better guide to what this strategy would have earned. For how fees, slippage and data mode shape a backtest, see Backtesting Data Quality: Why Fees, Slippage and Data Mode Decide Whether Results Are Real.
A useful rule of thumb when comparing backtesting software is to check fee modelling early. In CoinQuant, maker and taker fees are set at order level (per the CoinQuant changelog, January 26, 2026), so a fee test like this one is a matter of changing one number and re-running.
The Practical Lesson
On one 101-trade Bitcoin strategy, the fee alone moved the five-year result from +54.78% (0%) to +26.47% (0.1%) to +3.34% (0.2%)
The profit factor fell from 1.20 to 1.10 to 1.01, so the edge survived each tested level, but only barely at 0.2%
The gap between fee-free and fee-inclusive results was larger than the fees paid, because fees compound
None of the runs included slippage, so any real slippage would come on top of these fees
This is one strategy, one asset and one window; a strategy that trades less often would pay the same fee fewer times
Before trusting any backtest, re-run it at your real fee level and one level higher. In CoinQuant, an AI trading platform, you can change the fee and keep every other setting identical, so the fee is the only variable. Build trading strategies on real data. No coding required.
Re-run your strategy at your real fee level. Run this fee test free on CoinQuant
Disclaimer:
Key Takeaway
