
How to Optimize a Crypto Trading Strategy Without Overfitting It

Every trader who has ever opened a backtesting tool knows the feeling: you change one setting, the result improves. You change another, it improves again. After an afternoon of tuning, the strategy looks brilliant. Then it meets live data and falls apart.
That afternoon was not optimization. It was memorization. Both activities use the same buttons, the same charts, and the same feeling of progress, which is why the line between them is so easy to cross.
This guide walks through a disciplined trading strategy optimization process: how to tune a crypto strategy's settings without fooling yourself, in a way you can run on CoinQuant without writing a single line of code.
Tuning and Curve-Fitting Are Opposite Skills
Optimization means finding settings that make a strategy work across many market conditions. Curve-fitting means finding settings that make a strategy look good on one specific stretch of history.
The difference shows up in how sensitive the result is. A robust strategy still works when a setting moves by 10%. A curve-fitted strategy collapses when you nudge one number, because its edge came from precision, not from principle.
There is a mathematical reason for this. Every parameter combination you test adds another chance of finding a fluke result. Test 1,000 combinations and the best one is, more likely than not, the luckiest one, not the best one. The more you search, the more disciplined the search has to be.
The Seven-Step Optimization Loop
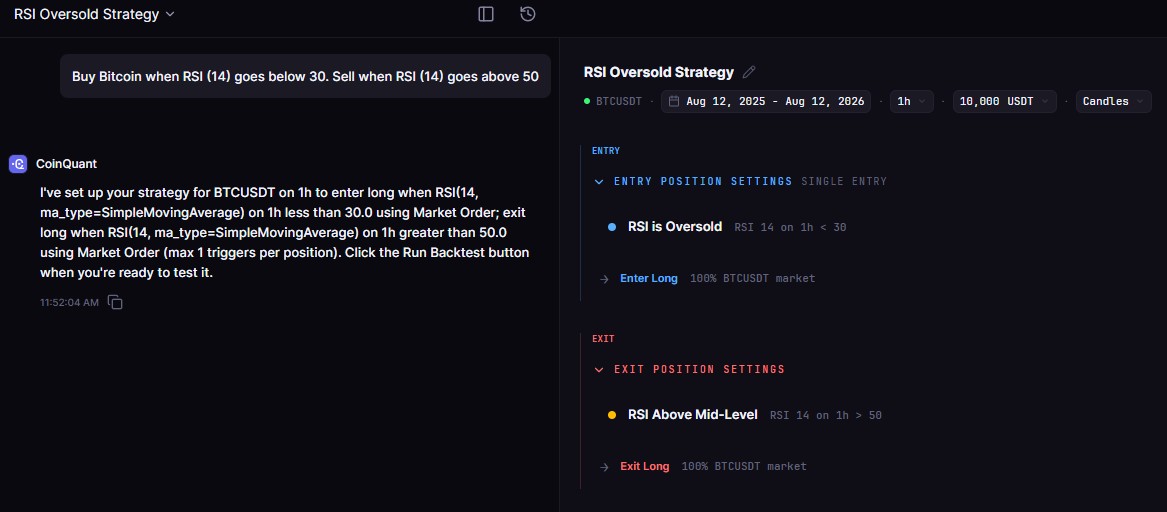
This process works on any strategy and any market. The example throughout is a familiar setup: buy BTC when the RSI crosses below 30 and exit when it crosses above 50, the same construction as the tested BTC RSI(14) mean reversion strategy in the CoinQuant library.
Step 1: Freeze the Rules Before Touching the Settings
Write the strategy in plain English first, exactly as you would type it into the CoinQuant strategy builder:
"Buy BTC when RSI(14) crosses below 30. Exit when RSI(14) crosses above 50. Long only, no leverage."
Now decide what you are allowed to tune. In this case, two things: the RSI thresholds and the lookback period. Everything else is frozen. The moment you start changing rules as well as settings, you are no longer optimizing one strategy, you are searching for a new one with every run.
Step 2: Set the Bounds Before You Start
Sensible parameters live inside sensible ranges. An RSI period of 2 is noise; a period of 200 barely moves. Before running anything, write down the range you will test and the step size, for example: period 7 to 21 in steps of 7, exit level 50 to 70 in steps of 10.
Bounds stop the search from creeping. Without them, every disappointing run invites "just one more" adjustment, and one more becomes twenty more.
Step 3: Split the Data Before You Tune
Choose a tuning window and a confirmation window, and do not touch the second one until the end. A common split: tune on the first four years of data, confirm on the most recent year.
The confirmation window is what turns a tuning exercise into a test. In CoinQuant you set the backtest period when you define the strategy, so both windows are a date-range change, nothing more.
Step 4: Change One Thing at a Time
Run the strategy once for every setting you want to test, changing a single value between runs, and log every run as you go. For each run, record:
The settings used (period, threshold, or whichever values are in play)
Total return and profit factor
Trade count, so you know how much evidence the run produced
Max drawdown, so you know what the result cost in risk
Total fees, so the result reflects after-cost reality
A log like this looks tedious and is the most valuable habit in the entire process. When you can see every run side by side, the single best number stops being the thing you chase. You are looking for the row whose neighbors are also reasonable, because that is the row most likely to survive a changing market.
Step 5: Look for Plateaus, Not Peaks
If adding or removing 5 points of exit threshold destroys the result, the setting is a peak, not a setting. Robust settings sit on a plateau: neighboring values give similar results. When you see a spike, change the value slightly and re-run. If the edge only exists at that exact number, you found luck, not logic.
Step 6: Re-test the Winner on the Data You Never Touched
Take the best robust settings from the tuning window and run them once on the confirmation window. No changes. This is the moment of truth: if the strategy holds its profile (a positive return with survivable drawdown, a reasonable trade count), it moves forward. If it collapses, it was tuned to the past.
Expect the confirmation result to look worse than the tuning result. It usually does, even for honest strategies. The question is how much worse, and whether the character of the strategy survives: same style of trades, similar win rate, similar holding periods.
Step 7: Decide With Rules You Wrote in Advance
Before the last run, write the pass criteria. Something like: positive return on the confirmation window, profit factor above 1.2, trade count above 10, drawdown within the level you would actually sit through. Then grade mechanically against it. The discipline is that the criteria cannot change after you see the result.
What to Compare in Every Run
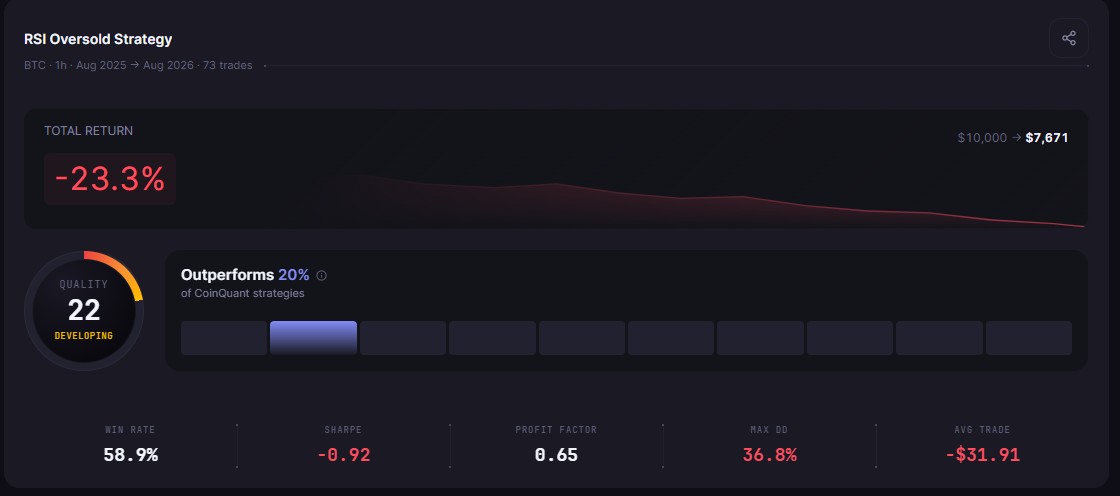
Every CoinQuant backtest reports the full metric set, fees included. These are the numbers that decide whether a setting is real:
| Metric | What it tells you | Warning sign |
|---|---|---|
| Total Return | The headline result | It is the number most easily inflated by tuning |
| Profit Factor | Gross profit per $1 of loss | Below 1.0 means the strategy loses money |
| Sharpe Ratio | Return per unit of volatility | Under 0.5 is weak for the risk taken |
| Max Drawdown | The worst peak-to-trough loss | Larger than you would tolerate live |
| Trade Count | How much evidence exists | Under 10 trades is an anecdote, not a test |
| Win Rate | How often trades succeed | A very high win rate with tiny average wins is fragile |
| Total Fees | The cost the strategy paid | If fees are ignored, the result is fiction |
A note on one number above: the tested BTC RSI(14) mean reversion strategy in the CoinQuant library returned +55.69% over five years with a profit factor of 3.04 and a 23.19% max drawdown. That is the reference point for what a clean, unfitted setup looks like: 13 trades, a modest win rate of 61.5%, and an edge that came from payoff structure rather than from precise settings.
Common Mistakes to Avoid
Tuning before freezing the rules. Changing rules and settings in the same session makes every run a different strategy
Testing too many combinations. More runs increase the chance the winner is a fluke, not a finding
Chasing the best number. The peak of the search is often the most overfitted point on the curve
Reusing the confirmation window. Once you tune against it, it stops being a confirmation window
Ignoring trade count. A beautiful equity curve from seven trades is a story, not evidence
Forgetting costs. A setting that trades twice as often must earn back twice the fees
The Practical Lesson
Freeze the rules, bound the settings, split the data, and change one thing at a time
Robust settings sit on plateaus; fragile ones sit on peaks you can only find in hindsight
The confirmation window is the only honest judge you have, and it works once
Pre-commit your pass criteria so the last run cannot rewrite the rules
Optimization is not the enemy of a good strategy. Undisciplined optimization is. Tune within a process, and every run teaches you something that survives contact with live markets. Skip the process, and you have simply found the settings that made the past look better.
Backtest your strategy free and run your first tuning loop on CoinQuant. Start your first backtest on CoinQuant
Disclaimer:
Key Takeaway
