
How Backtesting Software Works: The 6-Step Pipeline and the Feature That Protects Each Step

Backtesting software is a tool that simulates a trading strategy against historical market data to estimate how it would have performed, before any real money is at risk. You describe the rules you would trade, the software runs them against the past, and you read the results before risking a dollar.
Each step in that process is a place results can quietly go wrong, and each feature worth paying for guards one of them. This guide walks through the six-step pipeline first, then ranks the protective features by how much damage a weakness can do.
What Backtesting Software Actually Does
One word does the heavy lifting: simulates. Nothing in a backtest touches a real market or moves real money. The software applies your strategy to historical prices step by step, as though you had been trading all along, and reports what would have happened to a starting balance after costs.
A useful contrast: paper trading, or forward testing, runs a strategy against new market data as it arrives; backtesting runs against data that already exists, which makes it faster, repeatable across market regimes, and the natural first stage of validation. A backtest is not a prediction machine or a live trading system: it organizes historical evidence about your rules and never places a real order.
Spreadsheets can do a rough version, but they struggle with exactly the details that decide results (see backtesting in Excel vs backtesting software).
How Backtesting Software Works: The Six-Step Pipeline
Branding aside, most engines follow the same six-step pipeline.
Step 1: Historical Data Goes In
Everything starts with price history: candles (open, high, low, close) at some resolution, or tick-level trade data, for your target market. Everything downstream inherits its flaws: gaps, errors, or a short history quietly distort every number that follows. The point to hold onto: look for data from a named, traceable source rather than loosely patched feeds, with enough history to include both bull and bear phases.
Step 2: Your Strategy Rules Become Machine Instructions
A strategy is a list of conditions: when to enter, when to exit, how much to trade, how to manage risk. The rules must be machine-checkable on every bar. "Buy the crossover" becomes: when the fast moving average crosses above the slow one, using only values known at that moment. That last clause matters enough to get its own checklist item below. If you do not code, no-code tools handle this step, turning a plain-English description into a complete rule set.
Step 3: The Engine Replays the Market and Simulates Every Trade
The engine replays history in order, usually bar by bar, evaluating your rules at each step; when a condition fires, it creates an order, finds a fill at a price the data says was available, then updates position, balance, and equity. Vectorized engines compute signals across whole price arrays at once, but the same timing rules apply. The subtlety is timing honesty: a trustworthy engine only lets your strategy act on prices that existed when you would have been acting. An engine that fills an order at a price from before the signal appeared is not simulating trading; it is manufacturing a fantasy.
Step 4: Costs Are Modeled Into Every Fill
Real trading has friction: exchange fees, slippage between expected and filled prices, and the bid-ask spread. A strategy that trades hundreds of times pays these costs hundreds of times. A simulation that fills orders for free is modeling a frictionless world that does not exist. Costs belong inside the engine, applied to every fill, with the assumptions visible so you can check them.
Step 5: Results Come Out as Metrics
When the replay ends, you get an equity curve and statistics. Total return says what the starting balance became. Win rate says how often trades ended positive. Profit factor compares gross profits with gross losses. Maximum drawdown says how far the account fell from its peak at the worst moment, the number that decides whether you can sit through the strategy. A risk-adjusted measure like the Sharpe ratio relates return to the bumps along the way. Individually, each number misleads a little; together, they sketch the strategy's shape.
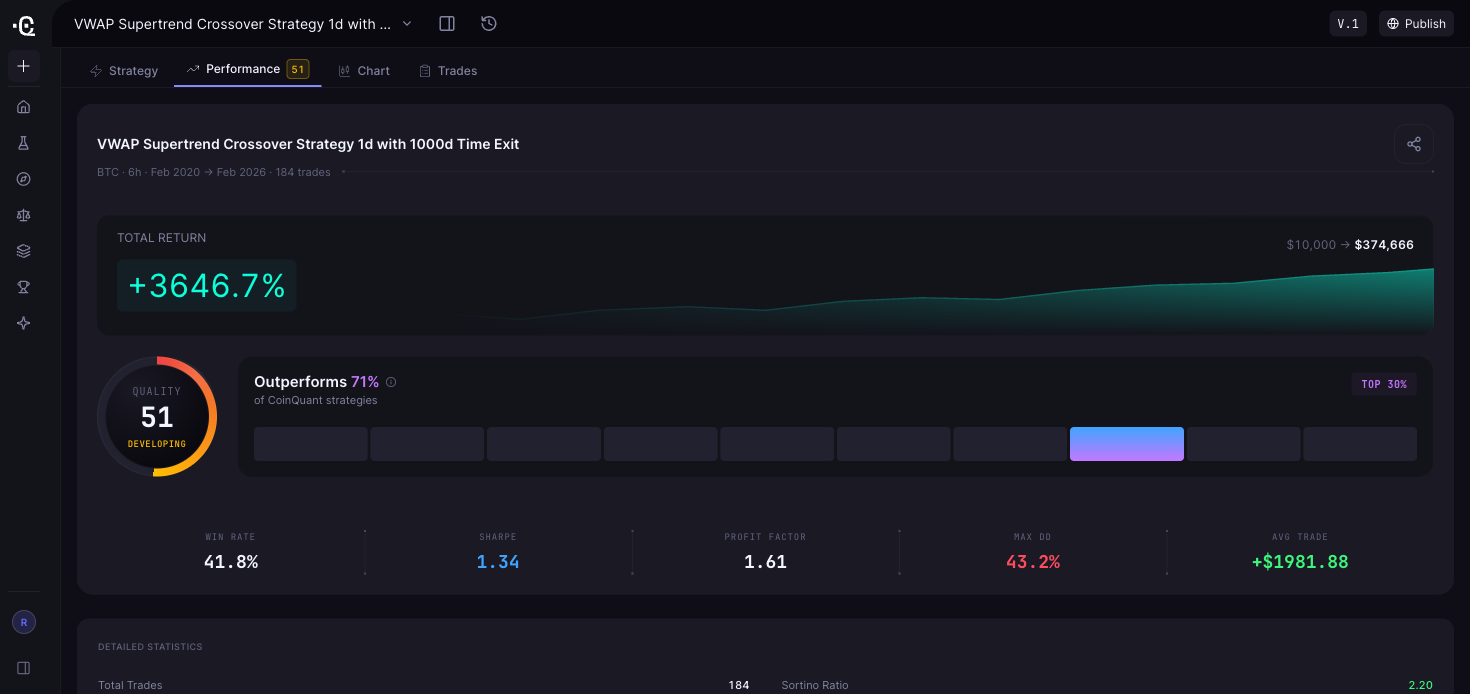
Example CoinQuant results screen from a historical BTC backtest: total return, Strategy Quality Score, win rate, Sharpe ratio, profit factor, maximum drawdown, and average trade side by side. A simulation of past data, not a forecast.
Step 6: You Iterate, Then Confirm Out of Sample
Few strategies hold up in their first version. You adjust a parameter, add a filter, rerun, and read the new numbers. This loop is the research process, and a tool that shortens it saves real time. But iteration has a trap built in: the more you tune a strategy to one stretch of history, the better it looks there and the less that look means. The fix is out-of-sample testing: tune on one window, then run the unchanged strategy on a window it has never seen. The second window is the evidence.
The Features That Protect Each Step, Ranked by Damage
Each feature below maps to a step where results can go wrong, ordered by how much damage a weakness there can do. For a deeper vendor-by-vendor framework, see choosing backtesting software in 2026.
1. Data Quality and Depth
This guards Step 1: if the prices are wrong, everything downstream is wrong. Look for a named provider and enough history to cover multiple market cycles; CoinQuant's crypto market data comes from partners including Kaiko.
2. Realistic Fee and Slippage Modeling
This guards Step 4, and a backtest that was too cheap is a common reason a strategy disappoints live. Look for costs in the default result, shown next to net return; CoinQuant builds fees and slippage into every backtest, so check the cost assumptions shown with each result.
3. Protection Against Look-Ahead Bias
This guards Step 3. Look-ahead bias is a simulation accidentally using future information: filling an order at a price from before the signal existed, or letting a rule read a candle before it closed. Ask how a platform sequences signals and fills, and read the trade log when you can. Each fill should use a price your strategy could actually have gotten.
4. Out-of-Sample and Walk-Forward Support
This guards Step 6. Single-window results are easy to produce and easy to misread. The features to look for are the boring, disciplined ones: the ability to hold back a period of history, run the unchanged strategy on it, and compare the two windows. Walk-forward testing repeats that split across successive periods. We walk through the full sequence in our guide to knowing whether a strategy will work before you risk real money.
5. A Metrics Set That Shows Risk, Not Just Return
This guards Step 5: one big return number tells the least interesting half of the story. Demand maximum drawdown and a risk-adjusted measure like the Sharpe ratio alongside win rate, profit factor, and trade count; CoinQuant reports these for each backtest, plus a Strategy Quality Score (SQS) from 0 to 100.
6. Iteration Speed and Usability
Research is a loop, and friction is where projects stall. The right interface lets you rerun a changed test quickly, and if you do not program, a no-code workflow beats a script editor you never finish learning (see how to develop a crypto trading strategy without any coding experience).
7. Asset Coverage That Matches Your Market
Coverage matters only where you trade. A platform spread across every asset class can still be shallow in the one market you care about, so check depth there: history length, candle resolutions, and whether tick-level data exists. CoinQuant supports crypto, plus stocks, ETFs, indices, forex, and commodities, with tick-level backtests for crypto on the Max Power plan (up to a 6-month range).
8. Honest Reporting of Weak Results
This one is cultural as much as technical, so check it before trusting what a platform shows you. Good tools make weak results as visible as strong ones: costs on by default, losing strategies visible in community libraries, no winners-only gallery. If every result a platform shows off is a winner, treat the marketing as marketing.
Common Misconceptions About Backtesting
A profitable backtest means the strategy will make money
It means the rules would have made money on that data. Live markets bring different conditions, and we cover the gaps between backtest and live performance in a separate guide. Treat a backtest as evidence about the past, not a promise about the future.
More trades means more reliable results
Volume of trades is not the same as quality of evidence. A thousand trades generated by a quirk of one bull market are still a quirk. Trades are meaningful when they come from one coherent rule set, across varied conditions, with costs applied; in crypto, frequency also multiplies fee drag fast. A reasonable sample of trades spread across several regimes says more than a flood of trades from a single one.
Optimization always improves a strategy
Tuning until the curve peaks often memorizes one window instead of improving the strategy. Prefer settings that hold across nearby values, and confirm on data you never tuned on; our guide to spotting a robust strategy versus an overfit one covers the warning signs.
From Plain-English Idea to Backtest: What It Looks Like in Practice
Say you have an idea about Bitcoin: trends persist, and you want in when a long-term trend confirms. On CoinQuant you type a prompt in plain English, such as "Create a SMA 200 crossover strategy for BTC on 1H." The platform turns it into a complete strategy with entries, exits, and sizing, and you refine it by conversation: "Add a stop loss at 1.5%." Running the backtest simulates the strategy on historical data, up to 500,000 bars per backtest, with fees and slippage built into the calculation. The results come back with return, win rate, profit factor, drawdown, Sharpe ratio, and a Strategy Quality Score. If the idea needs work, you refine it and run it again.
That loop (describe, test, read the numbers, refine) is the six-step pipeline in conversation form. A backtest is a simulation and places no orders; the goal is not a pretty curve, it is numbers you can trust.
FAQ: How Backtesting Software Works
Which backtesting feature matters most?
Data quality comes first, because every later step inherits bad prices, with realistic fee and slippage modeling a close second, since a frictionless result can make a losing strategy look like a winner. After those, look-ahead protection and out-of-sample support decide whether a good result means anything.
Where do backtests most often go wrong?
Usually in the quiet steps: data with gaps or too little history, fills at prices the strategy could not have known, costs left at zero, and heavy tuning on a single window. Each maps to a step in the pipeline above, which is why reading the trade log and the cost assumptions matters as much as reading the return.
Is backtesting software the same as paper trading?
No. A backtest runs your rules against historical data; paper trading, or forward testing, runs them against new data in real time with simulated money. They answer different questions: whether the rules held up in the past, and how the setup behaves now. The two complement each other.
Can a backtest predict how much money I will make?
No, and any tool implying otherwise is overselling. A backtest estimates how a strategy would have performed on historical data; it cannot know future conditions or account for regime changes and shifts in liquidity. Read it as evidence: does the logic hold after costs, across periods, and out of sample?
How far back should backtest data go?
Far enough to include more than one market environment: a rally, a drawdown, a recovery, if the history allows. A strategy tested in only one regime has not really been tested. Depth matters more than any single number of years, and finer resolutions consume history faster, so check what a platform supports per backtest. For a fuller answer, see how much history a crypto backtest needs.
The Bottom Line
Backtesting software is not a fortune teller; it is a simulator, and the pipeline follows broadly the same steps from tool to tool: data, rules, replay, costs, metrics, iteration. Demand traceable data, honest fills, costs modeled by default, out-of-sample discipline, metrics that show risk next to return, and a workflow that keeps the loop short. Do that, and you are doing research.
Describe a strategy in plain English and backtest it on CoinQuant before you risk capital:
Disclaimer:
Key Takeaway
