
Backtesting Data Quality: Why Fees, Slippage and Data Mode Decide Whether Results Are Real

Two traders can run the same strategy on the same dates and get different results, and the difference is usually not the strategy. It is the data quality settings: whether fees were modeled, how slippage was estimated, and whether the data was tick-accurate or approximated. Backtesting data quality is the difference between a result that means something and a number that only looks like one.
This guide explains the three settings that decide whether backtest results are real, using verified CoinQuant library runs as examples.
Fee Modeling: The Silent Tax
Every trade costs money, and a backtest that ignores fees reports fantasy returns. The standard modeling is a taker fee per trade, and on high-frequency strategies the fee drag becomes the entire story.
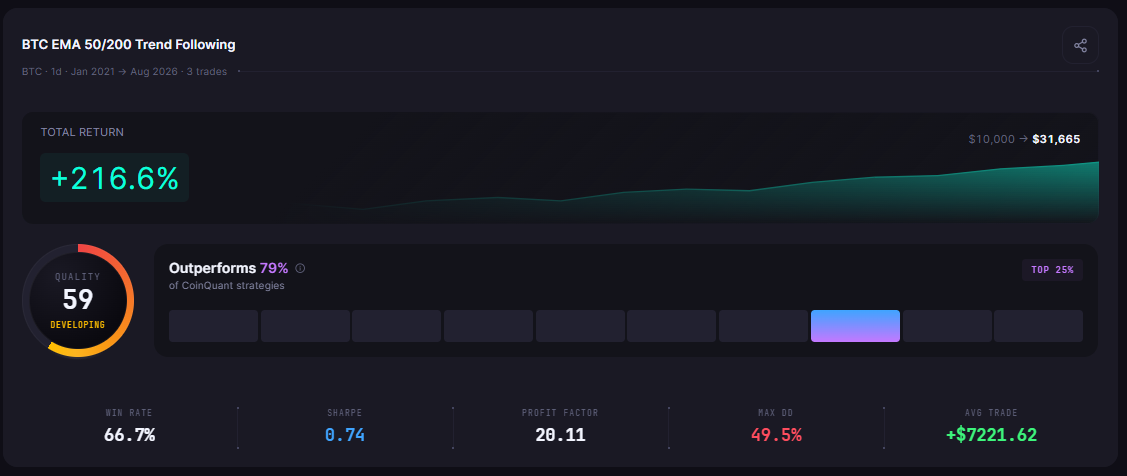
The verified CoinQuant library runs show the range of the effect. The AI RSI 4H Cross Strategy traded 401 times on BTCUSDT 4H and paid $14,471.38 in total fees, on a $10,000 account that finished at $12,806.09. The fees alone were larger than the strategy's total profit. At the other extreme, the AI EMA 50/200 1D Trend Strategy traded three times and paid $78.34 in fees.
| Strategy (library name) | Trades | Total fees | Total return |
|---|---|---|---|
| AI RSI 4H Cross Strategy | 401 | $14,471.38 | +28.06% |
| BTC OBV(20) Trend 1D | 36 | $1,046.70 | +57.27% |
| BTC Trend Following 1D 2021-2026 | 25 | $654.79 | +82.80% |
| BTC EMA Crossover 20/50 1D 2021-2026 | 16 | $459.09 | +79.16% |
| BTC RSI(14) Mean Reversion 1d | 13 | $364.32 | +55.76% |
| AI EMA 50/200 1D Trend Strategy | 3 | $78.34 | +216.65% |
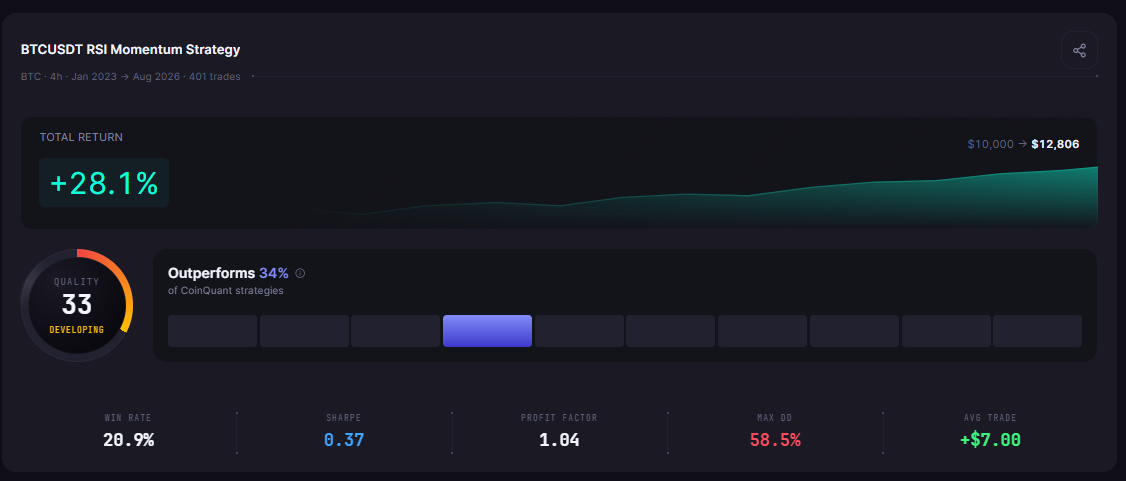
The pattern is mechanical: trade count decides fee impact. A strategy that trades 400 times a year on a small account is paying a percentage of its equity in fees every month, and the backtest shows it when fees are modeled.
Slippage: The Gap Between Signal and Fill
Slippage is the difference between the price that triggered a signal and the price actually filled. In fast markets the gap widens, and in thin order books it can exceed the strategy's per-trade edge.
The honest backtest models slippage explicitly. CoinQuant's engine includes slippage settings per strategy, with fixed basis-point models applied on every fill, alongside the fee model. A backtest that assumes fills at the exact signal price is a backtest of a market that does not exist.
The practical test for slippage realism: compare the backtest's average fill price with the signal price on volatile days. If the model has no slippage at all, the result is only valid in a market where you can always trade at the last tick, which is not the market anyone trades.
Data Mode: Bars vs Ticks
The data mode decides the resolution of the test. Bar-based backtests work on aggregated candles, which is the right tool for most strategy research and the default for daily and intraday rules. Tick-level backtests work on the individual trades that made up each bar, which matters when a strategy's edge depends on micro-timing.
The practical difference: a bar-based test can miss what happened inside a candle. If a strategy enters and exits within the same hourly bar, bar data cannot represent the sequence of fills, and the result is approximate. Tick-level data resolves the bar into its actual trades, at a much higher compute cost.
CoinQuant supports both modes, with tick-level backtests available on the Elite plan and bar-based backtesting on Pro and Elite.
The Data Source Question
The underlying price history is the foundation everything else sits on. Exchange data quality varies, and the reputable approach is institutional data. CoinQuant sources crypto data from Kaiko, with Binance, Coinbase and Kraken coverage, and BTC history back to 2017.
The practical checks for a data source:
Does it include the actual exchange venues you trade?
Does it cover the full window you want to test, including the 2021 bull and 2022 bear?
Is it adjusted for splits, delistings and other corporate events where relevant?
A strategy tested on one venue's data and deployed on another venue carries an unmeasured gap, because the same instrument can trade differently across exchanges.
How to Read a Results Panel for Data Quality
A backtest results panel contains the data quality audit if you know which lines to read. Three lines matter most:
Total Fees: the cumulative fee cost. Compare it with the total profit. If fees are a large fraction of profit, the strategy is a fee collector, and the trade frequency is the problem
Total Trades combined with Time in Market: a high trade count with low time in market means the strategy churns, and churn is the fee engine
Max Drawdown: the drawdown number is only trustworthy if fees and slippage were modeled, because the same strategy without them shows a smaller, fake drawdown
Every verified library backtest reports these lines from the same engine, which is why the numbers are comparable across strategies. A results panel that does not show fees is not showing you the strategy, it is showing you the strategy minus its costs.
Common Data Quality Mistakes
Four mistakes show up in most backtests that fail live:
No fees modeled. The backtest looks profitable, and the fee drag quietly removes the edge in live trading
No slippage model. Every fill assumed at the signal price, which is optimistic in exactly the fast markets where signals fire
Bars only, where ticks matter. Micro-timing strategies evaluated on candles that cannot represent the fills
Wrong or thin data history. Testing on 12 months of one regime and concluding the strategy works across cycles
Each mistake is fixable in the settings, and each one changes the verdict. That is the point of the article: the settings are the methodology.
The Practical Lesson
Fees are the first filter. If a strategy cannot survive modeled fees on historical data, it will not survive them live
Slippage is the second filter. Fixed basis-point modeling is the minimum bar for realism
Data mode is the resolution question. Bars for research, ticks when the edge depends on intra-bar timing
The data source is the foundation. Institutional exchange data with full-cycle history is what makes the other settings meaningful
The library runs cited above all include modeled fees and slippage on Kaiko exchange data. That is why their numbers are quotable, and why the same strategy without those settings would produce a different, less honest result.
Backtest on real exchange data on CoinQuant
Disclaimer:
Key Takeaway