
Best crypto trading strategy for beginners in 2026: write these six rules before you trade
A complete-rule checklist and untested worked examples for careful beginner research.

Quick answer: There is no single best crypto trading strategy for beginners in 2026, and any answer that names one without context is oversimplifying. A sensible first strategy has a few properties: simple, fully written rules that trade rarely, on a liquid asset such as Bitcoin, with no leverage, a small fixed risk per trade, trading costs included and a buy-and-hold benchmark to beat. This guide shows the six rules every strategy needs, then walks through one complete beginner example, rule by rule, with the sizing math. Whichever approach you pick, test it on historical data before you trade it, then trade it small before you trade it seriously.
What is a crypto trading strategy and how does it work?
A crypto trading strategy is a written set of rules that decides what you trade, when you enter, when you exit, how much you risk, and what you do when things go wrong. It is a decision framework, not a prediction. It answers one narrow question: under exactly which conditions will I act?
That narrowness is the point. "Buy when it looks cheap" cannot be followed the same way twice or tested. "Buy at the next daily open after Bitcoin closes above its 100-day average" can be followed by anyone and run against price history.
The six rules of a complete strategy
| Rule | The question it answers |
|---|---|
| 1. Market and timeframe | What do I trade, and on which candles? |
| 2. Entry | Exactly when do I open a position? |
| 3. Exit | When do I close, in both good and bad cases? |
| 4. Position size | How much goes into each trade? |
| 5. Risk limits | What caps the damage across all trades? |
| 6. Costs and fills | What will fees and slippage cost, and at what price do orders fill? |
If any row is blank, you have an idea, not a strategy. Beginners skip the last row most often, and it often decides whether a result is real. Our guide to what makes a crypto trading strategy work covers entries, exits, sizing and risk in more depth and shows the market condition that breaks each strategy type.
From idea to live trade
- Idea: a belief about price behavior, such as "strong Bitcoin trends tend to persist."
- Rules: the idea written as the six rules, with nothing left to judgment.
- Backtest: the rules run on historical data with fees and slippage, producing a trade list, equity curve, maximum drawdown and buy-and-hold comparison.
- Out-of-sample check: the same rules on a period you did not use while building them.
- Small live trial: real orders at small size, to measure the gap between backtest and real fills.
- Review: a scheduled check that live behavior still matches tested behavior.
Steps 3 and 4 are where bad ideas should fail, cheaply. No step predicts the future. As a U.S. Commodity Futures Trading Commission customer advisory on AI trading bots puts it, "AI technology can't predict the future or sudden market changes." Rules can't either. What they give you is a process you can measure.
What is the best crypto trading strategy for beginners this year?
The best crypto trading strategy for beginners this year is the one that fits your time, temperament and risk tolerance, and that survives testing with costs included. That is a set of properties, not a named system:
- Few rules. One or two entry conditions and one clear exit.
- Low frequency. Daily or 4-hour decisions mean fewer fees and fewer chances to break your own rules.
- Liquid markets. Major pairs such as BTC or ETH against a stablecoin, where spreads are usually tighter than in small altcoins.
- No leverage. The CFTC's advisory on virtual currency risks notes that profits and losses from crypto volatility "are amplified in margined futures contracts."
- A defined losing exit. A stop or a rule-based exit, decided before entry.
- Drawdowns you can sit through. If the worst tested slide would make you quit, the strategy is wrong for you.
- Fully testable. No judgment calls.
How common strategy families fit beginners
| Family and core idea | Beginner fit | Typical way it fails |
|---|---|---|
| Dollar-cost averaging (DCA): buy a fixed amount on a schedule | High, as an accumulation plan | Long declines; spreading entries does not prevent losses |
| Trend following (moving averages): trends tend to persist | Medium to high on daily candles | Sideways markets produce repeated small losses |
| Mean reversion (RSI, Bollinger Bands): stretched prices snap back | Medium | Strong trends keep moving against the position |
| Breakout: price escaping a range keeps going | Medium | False breakouts reverse soon after entry |
| Grid trading: profit from price moving back and forth in a range | Low to medium | A trend leaves the grid holding losing positions |
| Scalping and leveraged day trading: capture many small, fast moves | Low | Fees, slippage and leverage overwhelm small edges |
The fit ratings are general editorial judgments, not measured results. The higher a family's trade frequency, the more fees and slippage matter. For each family in more depth, see every crypto trading strategy type explained.
Worked example: write a beginner strategy in six rules
The example below is an educational illustration only. It was not backtested for this article, no performance is claimed or implied, and it is not a recommendation to trade. It shows how to specify a strategy. Binance BTCUSDT spot is the illustrative data venue in the table, not an endorsement or a statement that this market is available in your jurisdiction. The fee and slippage figures are teaching assumptions, not exchange quotes.
Example A: a daily trend-following rule on Bitcoin
| Rule | Specification |
|---|---|
| 1. Market and timeframe | Binance BTCUSDT spot data (illustrative venue), daily candles in UTC. Long only, one position at a time, no leverage. Signals are evaluated only on completed daily closes (00:00 UTC). |
| 2. Entry | Buy when the daily close crosses above the 100-day simple moving average (SMA) of closes: today's close is above today's SMA and the previous close was at or below the previous SMA. Fill at the next daily open. |
| 3. Exit | Sell at the next daily open after a daily close below the 100-day SMA. Protective stop: a stop-market order 8% below the entry fill price, placed right after entry. After a stop-out, wait for a fresh cross before re-entering. |
| 4. Position size | Risk 1% of account equity per trade, with costs counted inside that 1%: position = (equity × 1%) ÷ (8% stop distance + 0.30% round-trip costs), rounded down to the nearest dollar. |
| 5. Risk limits | Live only: pause and review if strategy equity falls 10% from its peak. In a backtest, note when this would have triggered but keep trading, so the results cover the whole window. |
| 6. Costs and fills | 0.10% fee plus 0.05% slippage per side, charged on the value of each fill. In the test, if a day's low reaches the stop, fill at the stop price; if a day opens below the stop (a gap), fill at that open. |
Two more settings make the test reproducible:
- Test window. Fixed start and end dates written down before running, for example January 1, 2021 to December 31, 2025, starting with $2,000 in USDT. Load at least 100 earlier daily candles as a warm-up so the average exists on day one, with no trades during the warm-up. Then repeat on other windows.
- Benchmark. Invest the initial $2,000 in BTC at the first test-day open, including the assumed 0.15% entry cost within that $2,000, rather than adding costs to the account. Hold to the final close and mark both accounts to that same close. Do not assume a final sale or exit fee for either account unless the test explicitly liquidates both. Compare net account return and maximum drawdown, both measured on total account value.
The sizing math, step by step
For the first trade on the hypothetical $2,000 account:
- Risk budget: $2,000 × 1% = $20.
- Position size: $20 ÷ (8% + 0.30%) = $20 ÷ 0.083 ≈ $240.96, rounded down to $240.
- Loss if the stop fills at its price: 8% of $240 is $19.20. Entry costs are 0.15% of $240, or $0.36. Exit costs are 0.15% of the $220.80 exit value, or about $0.33. The total is about $19.89, inside the $20 budget.
- It can be more. A stop order becomes a market order when triggered, and Investor.gov's guide to order types notes that a market order "does not guarantee the execution price." Crypto can move through a stop level quickly, which is why the test fills gaps at the open, not at the stop price.
- A losing streak: each stop-out costs at most about 1% of current equity when fills behave as assumed, so ten in a row would cost a little under 10% (0.99 multiplied by itself ten times is about 0.904, a loss of about 9.6%), more if any stop gaps.
What this example does not tell you
- Fill timing is simplified. In a backtest, "next daily open" means the first price of the new candle. A live order sent moments after 00:00 UTC can fill at a different price, and the 0.05% slippage assumption is not a measurement. Apply adverse slippage to the assumed buy or sell fill and record fees separately. The sizing calculation uses a conservative approximate round-trip cost; a gap can still exceed the planned risk. Daily candles do not show the order of prices within a day, so the stop-fill rule remains an assumption.
- Low exposure shapes the result. Only about 12% of the account ($240 of $2,000) is invested at a time, and the rule is flat whenever Bitcoin closes below its average. A smaller drawdown than buy-and-hold would therefore partly reflect less money at risk, not only better timing, and the rule can lag badly in strong rallies. If the trade-off is not worth it after costs, the honest conclusion is to hold or keep researching.
Example B: scheduled DCA, the simplest alternative
Dollar-cost averaging is an accumulation plan, not a trading system, but it can be written and tested the same way. An illustrative version using the same Binance BTCUSDT spot venue and UTC convention: allocate $50 including costs every Monday at 00:00 UTC for 52 weeks. With an assumed combined 0.15% fee and slippage budget, about $49.93 buys BTC each week. Hold $2,600 in USDT from day one, with no exit; choose and record the first Monday before testing. Value holdings at the final day's close in week 52, and compare with investing the full $2,600, including the same entry-cost assumption, at the first Monday's open.
Investor.gov defines dollar-cost averaging as "investing your money in equal portions, at regular intervals, regardless of the ups and downs in the market." It spreads entry prices. It does not protect you if the asset falls and stays down. Because the DCA account holds cash for most of the year, the lump-sum comparison measures timing and exposure together. If you would really fund $50 a week from income, you never had $2,600 on day one, so compare against simply holding that cash instead.
What beginners should skip for now
Skip leverage, 1-minute scalping and hype-driven coin chasing until a simple, unleveraged rule set has been tested and traded small. Be especially wary of "guaranteed" bots and signal groups: the CFTC warns that fraudsters "tout automated trading algorithms, trade signal strategies, and crypto-asset trading schemes that promise unreasonably high or guaranteed returns."
Manual vs automated crypto trading strategies: which should a beginner use?
Manual vs automated crypto trading strategies can use identical rules. The difference is who executes them. In manual trading, you watch for signals, decide and click. In automated trading, software places orders when the rules trigger, without approval for each trade. There is also a middle path: software sends an alert and you place the order yourself.
| Dimension | Manual | Automated |
|---|---|---|
| Who acts on a signal | You, when you see it | Software, when conditions are met |
| Consistency | Depends on your discipline and mood | Rule-based action while operating correctly; outages can prevent execution |
| Coverage | Limited by sleep and attention in a 24/7 market | Continuous while running; still needs monitoring |
| Typical failure | Hesitating, moving stops, revenge trading | Repeating a flawed rule faithfully; silent outages |
| Costs | Your time plus exchange fees and slippage | Software subscription plus exchange fees and slippage |
| What it proves about the rules | Nothing on its own | Nothing on its own |
The last row matters most. Automation can execute rules consistently while running correctly, but it cannot judge whether the rules have an edge. It can repeat a flawed rule or fail during an outage. The CFTC's bot advisory also tells readers to "consider the impact fees, spreads, and subscription costs would have on returns."
A sensible order for beginners:
- Write the rules down as the six rules above.
- Backtest them with costs included, against buy-and-hold.
- Execute manually or with alerts, at small size, and log every trade, so you learn what a drawdown feels like.
- Automate only when the rules have passed testing and small live results roughly match the backtest.
For how the risks change once software executes your rules, see manual vs automated crypto trading: how the risks differ. For what each side costs, see what crypto strategy automation actually costs in 2026.
Simple vs complex crypto strategies in 2026: how much complexity do you need?
When comparing simple vs complex crypto strategies in 2026, complexity means the number of choices that could have been made differently: indicators, parameters, filters, timeframes, assets and position layers. Each choice is a place where a backtest can fit past noise instead of a real pattern.
| Dimension | Simple strategy | Complex strategy |
|---|---|---|
| Rules and parameters | A few, each with a clear reason | Many, often interacting |
| Explainability | You can say why it enters and exits | Hard to tell which part drives results |
| Overfitting risk | Lower | Higher, because more settings can be tuned to history |
| Testing needed | Backtest plus an out-of-sample check | Out-of-sample, walk-forward and parameter-stability checks |
| How it breaks | Visibly, in conditions it was never built for | Quietly, when a tuned combination stops working |
In The Probability of Backtest Overfitting, David H. Bailey, Jonathan Borwein, Marcos López de Prado and Qiji Jim Zhu write that standard techniques designed to prevent regression overfitting, such as holdout, "tend to be unreliable and inaccurate in the context of investment backtests." The practical lesson for beginners: the more variations you try, the more likely it is that your best-looking backtest is best by luck.
What a separate published test reports. CoinQuant's matched Bitcoin backtest article reports a Bias(20) mean-reversion rule on BTCUSDT spot (Binance): daily candles from August 1, 2021 to August 1, 2026, $10,000 at 100% of equity per entry, a 0.1% taker fee and no slippage set. Its table reports +40.06% return and 24.18% maximum drawdown for the version with two added filters, against +30.73% and 38.13% for the single rule. Trade counts were 13 and 17 respectively, over five years. Neither reported strategy return beat buy-and-hold (+57.33% return, 76.63% maximum drawdown). These are attributed results from that separate article, not tests of Example A or B and not independently reproduced here. One asset, one window and such small trade counts do not establish a general advantage for complexity.
AI tools can turn a paragraph into a multi-indicator strategy quickly. Generating complexity got easier; validating it did not. The rule of thumb: start simple, and make complexity earn its place.
- Add one rule at a time, and keep it only if it improves results on data you did not use to build it.
- Prefer rules with a reason ("skip entries when volatility is extreme") over rules found by searching ("RSI 37 beat RSI 30").
- Watch the trade count. If a filter leaves too few trades to judge, the result became less trustworthy, not better.
- Check neighboring settings. If a 100-day average looks good but 90 and 110 look poor, the edge is probably fragile.
- Compare every version against the same benchmark and cost assumptions.
Our guide on how to optimize a crypto trading strategy without overfitting it walks through this step by step.
Test before you trade: the beginner checklist
Run through this before any strategy gets real money:
- All six rules are written down, with no judgment calls.
- Signals use only closed candles, orders fill on the next bar, and the stop and gap rules are stated.
- Fees and slippage are included in the test, not subtracted later.
- The test window and warm-up period were fixed before you looked at results.
- The window includes rising, falling and sideways periods, and results are compared with buy-and-hold.
- You would stick with the strategy through its maximum drawdown.
- There are enough trades to judge. A handful of trades is an anecdote, not evidence.
- The rules held up on an out-of-sample period and with neighboring parameter values.
- A small live trial, a pause rule and a review date are set before you start.
Reading a backtest honestly
| Metric | What it tells you | Beginner trap |
|---|---|---|
| Net return after costs | What would have remained after fees and slippage | Quoting gross return |
| Maximum drawdown | The worst peak-to-trough fall | Ignoring it because the return looks good |
| Buy-and-hold comparison | Whether the rules added anything over holding | Beating zero instead of beating the benchmark |
| Exposure | How much of the account was actually invested | Crediting timing for a drawdown that is small only because little was invested |
| Number of trades | How much evidence there is | Trusting 8 trades as if they were 80 |
| Win rate | How often trades closed positive | Ignoring that a few large losses can erase many small wins |
For why drawdown deserves the first look, see maximum drawdown in crypto trading. For writing stops, take-profits and position size into the strategy itself, see crypto risk management for systematic traders.
Copy the prompt: Example A in plain English
If you use a plain-English backtester, this prompt is a short version of Example A. It is a starting point for your own test, not a tested or recommended strategy:
Build a long-only strategy on BTC/USDT using daily candles. Enter at the next daily open when the daily close crosses above the 100-day simple moving average. Exit at the next daily open when the daily close crosses below the 100-day simple moving average, or with a stop loss 8% below the entry price. Use 12% of equity per trade. Backtest from January 1, 2021 to December 31, 2025, and compare the result with buying and holding BTC over the same window.
Two notes before you read the results. First, "12% of equity" approximates the 1% risk sizing rule above; if your tool cannot size by risk, record that difference, because the test then answers a slightly different question. Second, check the fee and slippage settings against your exchange, then check that every rule, including the stop and fill timing, came through as written. The short prompt leaves out the illustrative Binance venue, the UTC close, the gap-fill rule, the 10% pause rule and the warm-up; set what your tool allows in its settings and record the rest as differences.
Where CoinQuant fits, and where it doesn't
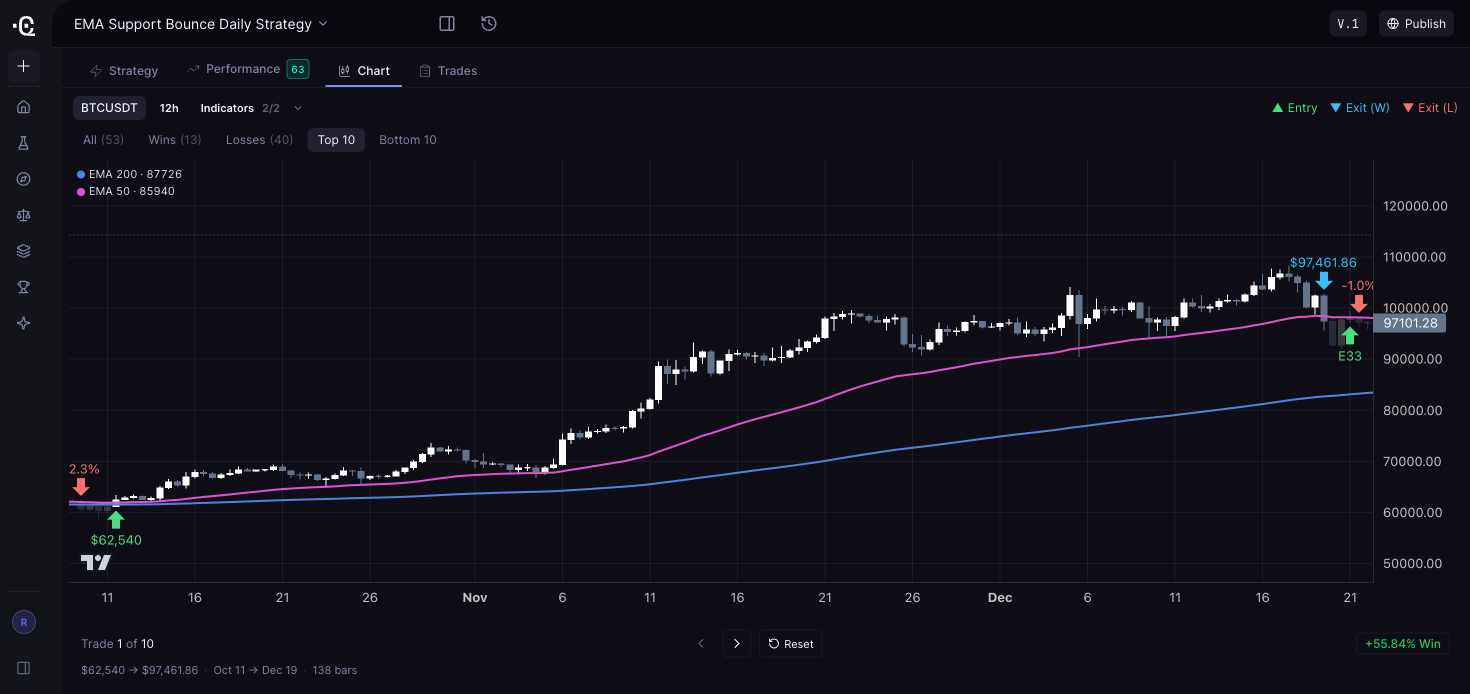
CoinQuant is a no-code AI strategy builder and backtester for the build-and-test steps above. You describe a strategy in plain English, the AI generates a structured strategy that you review and adjust, and CoinQuant backtests it on historical data. CoinQuant documents trading-fee modeling in each backtest; check the slippage value in your own run, because CoinQuant's matched test cited above was run with a 0.1% taker fee and no slippage set. Results include an equity curve, drawdown, detailed statistics, a trade log, a buy-and-hold line and a strategy quality score (SQS) from 0 to 100, and you can edit the rules or refine the prompt, then re-run the backtest.
The honest caveats:
- This article covers the build-and-test stage only. CoinQuant's security notice describes it as "a platform for building and backtesting trading strategies on real data, not a broker, exchange, or wallet."
- The SQS summarizes a backtest. It does not establish future returns.
- Data resolution depends on the plan. Pro backtests use candles from 15 minutes to 1 month, a range that includes daily candles. The higher-priced plan adds 1-minute candles and tick-level backtests over a six-month range. Daily or 4-hour beginner rules generally do not need tick data.
- It is a paid product. As checked on CoinQuant's pricing page on October 8, 2026, Pro is $39.99 a month billed monthly, or $399 billed yearly (shown as $33.25 a month). The higher-priced plan is $220 a month billed monthly, or $1,999 billed yearly (shown as $166.58 a month). Weekly billing is also listed. Plans include credits, and different actions use different amounts of credits.
FAQ
How much money should a beginner start with?
No amount makes a strategy work. Only trade money you could lose entirely without affecting your finances, and size each trade so a long losing streak is survivable. Backtesting on historical data does not put trading capital at risk.
Is dollar-cost averaging a trading strategy?
It is an accumulation plan with a fixed schedule and usually no exit rule. It can still be written down and tested, and it makes a useful benchmark for active rules.
Can AI tell me which strategy will work?
No. AI can help turn an idea into precise rules and suggest variations to test. It cannot know how markets will behave next. Treat AI output as a draft to test, never as a verdict.
Does a good backtest mean a strategy will make money?
No. A backtest shows how rules would have behaved on past data under the cost and fill assumptions you chose. Live results can differ because of slippage, changing market conditions and overfitting.
Conclusion: the practical lesson
There is no best strategy for every beginner. Start with six written rules, conservative sizing and no leverage. Test those rules with costs and a benchmark, inspect the losing periods, and let evidence justify each extra rule or move toward automation.
- No single strategy is best for every beginner, and none is safe from losses.
- A good first strategy is six written rules: market and timeframe, entry, exit, position size, risk limits, and costs and fills.
- Size each trade so being wrong is affordable; in the worked example, a stop-out costs about 1% of the account.
- Compare every result with buy-and-hold, and read drawdown and trade count before return.
- Add automation and complexity only when the evidence asks for them.
Copy the Example A prompt above and run it in CoinQuant as a starting point. Before you read the results, check the fee, slippage, stop and fill settings against the six rules and note anything the build could not match. Then compare the trade log, drawdown and buy-and-hold line, with fees included, before any money is at risk.
Start your first backtest on CoinQuant (https://app.coinquant.ai/)
Related reading
- What makes a crypto trading strategy work? 5 components and where each strategy type breaks (https://www.coinquant.ai/blog/what-makes-a-crypto-trading-strategy-work-5-components-and-where-each-strategy-type-breaks)
- Simple vs complex trading strategy: one entry rule vs three in a matched Bitcoin backtest (https://www.coinquant.ai/blog/simple-vs-complex-crypto-trading-strategy-backtest)
- Crypto trading strategies: every type explained (2026 guide) (https://www.coinquant.ai/blog/crypto-trading-strategies-every-type-explained-2026-guide)
- Manual vs automated crypto trading: how the risks differ when software executes your rules (https://www.coinquant.ai/blog/manual-vs-automated-crypto-trading-how-the-risks-differ-when-software-executes-your-rules)
- How to optimize a crypto trading strategy without overfitting it (https://www.coinquant.ai/blog/how-to-optimize-a-crypto-trading-strategy-without-overfitting-it)
- Maximum drawdown in crypto trading: how to read it and why it matters more than returns (https://www.coinquant.ai/blog/maximum-drawdown-in-crypto-trading-how-to-read-it-and-why-it-matters-more-than-returns)
Sources
The original source reference date is October 8, 2026. The separate reported test is linked below; its figures are attributed, not independently reproduced here.
- U.S. Commodity Futures Trading Commission, AI Won't Turn Trading Bots into Money Machines (customer advisory)
- U.S. Commodity Futures Trading Commission, Understand the Risks of Virtual Currency Trading (customer advisory)
- Investor.gov (U.S. SEC), Dollar Cost Averaging
- Investor.gov (U.S. SEC), Types of Orders
- Bailey, Borwein, López de Prado and Zhu, The Probability of Backtest Overfitting (revised version, February 2015)
- CoinQuant, Simple vs Complex Trading Strategy: One Entry Rule vs Three in a Matched Bitcoin Backtest (published October 5, 2026)
- CoinQuant, Pricing and Security
Disclaimer:
Key Takeaway