
Simple vs Complex Trading Strategy: One Entry Rule vs Three in a Matched Bitcoin Backtest

"How does a simple crypto trading strategy compare to more complex ones?" is a question traders now put to AI assistants. A simple vs complex trading strategy question can also be tested directly: take one entry rule, add filters, keep everything else identical and compare.
This article does exactly that on daily Bitcoin from August 2021 to August 2026. The short answer from this one test: the version with two added filters returned +40.06% against +30.73% for the single-rule version, with a much shallower drawdown (24.18% against 38.13%). It did that on only 13 trades, and the trade log shows why that number deserves caution.
Neither version beat simply holding Bitcoin on return (+57.33%), though both had far smaller drawdowns. Buy and hold fell as much as 76.63% from its peak along the way.
Simple vs Complex Trading Strategy: The Two Versions Tested
Both versions trade the same idea: buy Bitcoin when it is stretched well below its 20-day average and sell when it returns to that average. The Bias indicator measures that stretch as the percentage distance between the close and its 20-period simple moving average.
Simple version (one entry rule):
Entry: Bias(20) crosses below -10, meaning the close has fallen 10% below its 20-day SMA
Exit: Bias(20) crosses above 0, meaning price is back at its average
Complex version (three entry rules, all required on the same bar):
Entry rule 1: Bias(20) crosses below -10 (unchanged)
Entry rule 2: RSI(14) is below 40, a momentum filter that asks for a genuinely weak market
Entry rule 3: ATR(14) is above its own 20-period SMA, a volatility filter that asks for an expanding range
Exit: Bias(20) crosses above 0 (unchanged)
The filter values were fixed before the run and not tuned. Each component already appears in a tested strategy in the library. In CoinQuant you would type the complex entry in plain English, for example: "Buy BTCUSDT daily when Bias 20 crosses below -10 and RSI 14 is below 40 and ATR 14 is above the 20-period SMA of ATR. Sell when Bias 20 crosses above 0." No coding required.
Test Setup
| Parameter | Simple version | Complex version |
|---|---|---|
| Strategy | BTC Bias 20 Reversion 1D 2021-2026 | BTC Bias 20 Reversion + RSI + ATR Filter 1D 2021-2026 |
| Entry | Bias(20) crosses below -10 | Bias(20) crosses below -10 AND RSI(14) below 40 AND ATR(14) above SMA(20) of ATR(14) |
| Exit | Bias(20) crosses above 0 | Bias(20) crosses above 0 |
| Instrument | BTCUSDT (spot, Binance) | BTCUSDT (spot, Binance) |
| Data source | Kaiko via CoinQuant | Kaiko via CoinQuant |
| Timeframe | Daily (1D) | Daily (1D) |
| Tested window | 2021-08-01 to 2026-08-01 | 2021-08-01 to 2026-08-01 |
| Initial capital and sizing | $10,000, 100% of equity per entry | $10,000, 100% of equity per entry |
| Fees | 0.1% taker, modelled (no slippage set) | 0.1% taker, modelled (no slippage set) |
| Direction | Long only, one position, no leverage | Long only, one position, no leverage |
Only the entry row differs. The BTC spot comparison, BTC Buy and Hold 1D 2021-2026, uses the same window, capital and fee.
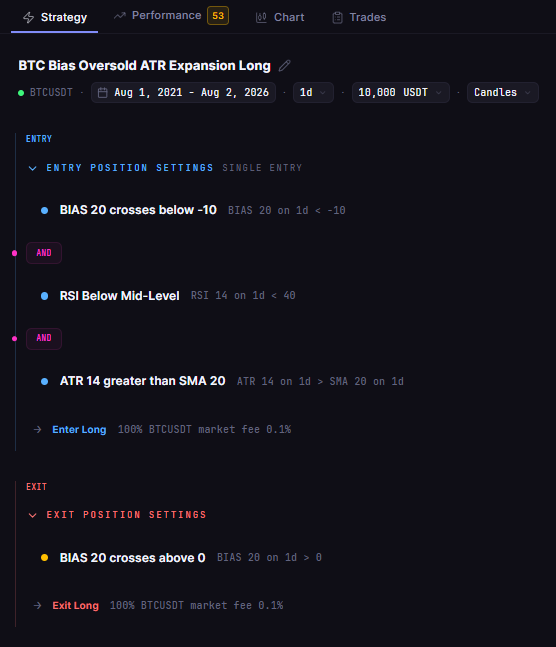
One entry rule became three: the complex version keeps the Bias(20) trigger and exit and adds an RSI momentum filter and an ATR volatility filter, all required on the same daily bar.
Screenshot from the author's CoinQuant account. Backtest results are hypothetical, based on historical data with modelled fees, and do not guarantee future performance. Not financial advice.
Results Side by Side
Adding the two filters cut the trade count from 17 to 13 and lifted the final balance from $13,073.45 to $14,005.91. Holding Bitcoin over the same window finished at $15,733.43.
| Metric | Simple version | Complex version | BTC Spot Comparison |
|---|---|---|---|
| Strategy | BTC Bias 20 Reversion 1D 2021-2026 | BTC Bias 20 Reversion + RSI + ATR Filter 1D 2021-2026 | BTC Buy and Hold 1D 2021-2026 |
| Total Return | +30.73% | +40.06% | +57.33% |
| Final Balance | $13,073.45 | $14,005.91 | $15,733.43 |
| Total Trades | 17 | 13 | 1 |
| Win Rate | 58.82% (10W / 7L) | 61.54% (8W / 5L) | n/a (single hold) |
| Profit Factor | 1.41 | 1.82 | n/a |
| Sharpe Ratio | 0.33 | 0.40 | 0.44 |
| Max Drawdown | 38.13% | 24.18% | 76.63% |
| CAGR | +5.50% | +6.97% | +9.48% |
| Best Trade / Worst Trade | +$1,864.56 / -$2,747.21 | +$1,794.81 / -$2,130.55 | n/a |
| Time in Market | 16.15% | 12.21% | 100% |
| Total Fees | $423.24 | $354.99 | $25.74 |
Small-sample warning: the complex version made only 13 trades in five years, and the simple version 17. At these counts, one or two trades can move every metric in this table, so read the gap as a description of this test, not a measured edge.
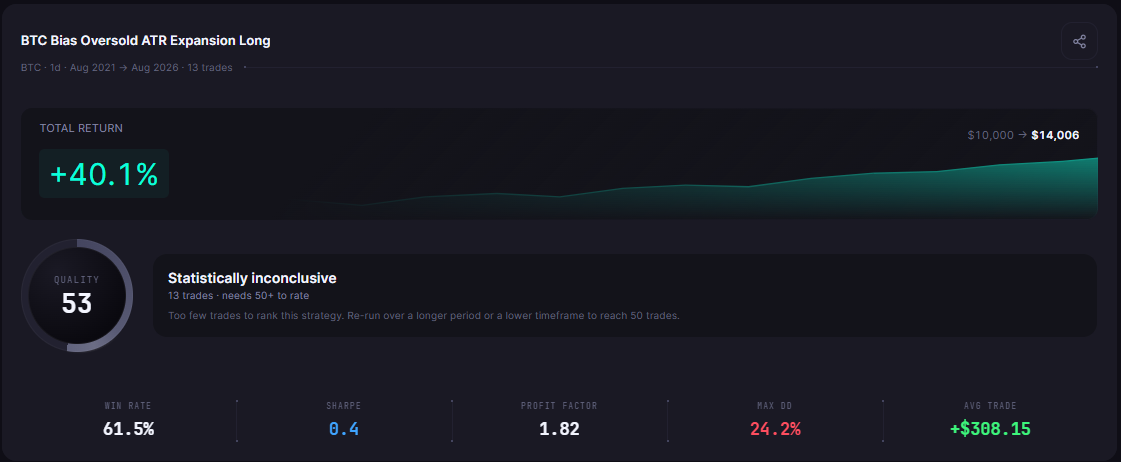
Same trigger, exit and window: the version with two added filters took 13 trades instead of 17 and finished at +40.06% with a 24.18% maximum drawdown, a small sample.
Screenshot from the author's CoinQuant account. Backtest results are hypothetical, based on historical data with modelled fees, and do not guarantee future performance. Not financial advice.
What the Two Filters Changed Together
The two versions share 12 trades with the same entry and exit dates. Six trades differ, and that is where the gap starts. The 12 shared trades then compounded it, because the complex version carried the larger balance into nine of them.
| Entry date | Simple version | Complex version |
|---|---|---|
| 2022-01-07 | -$20.32 | Filtered out |
| 2022-01-21 | Not taken (already in a position) | +$1,540.35 |
| 2022-02-21 | +$1,822.27 | Filtered out |
| 2022-04-11 | +$26.27 | Filtered out |
| 2022-06-12 | -$2,747.21 | Filtered out |
| 2023-03-09 | +$1,864.56 | Filtered out |
Three effects stand out:
The filters skipped the worst trade. The simple version's -$2,747.21 loss from June to July 2022 never happened in the complex version. In the trade log, that trade also carries the simple version's deepest in-trade drawdown (33.69%), which goes a long way to explaining the gap between the two maximum drawdowns (38.13% against 24.18%).
They also skipped the best trade. The +$1,864.56 rebound in March 2023 and a +$1,822.27 trade in February 2022 were filtered out too.
One trade was a side effect of timing. The complex version was flat on 2022-01-21 because it had skipped the 2022-01-07 entry, so it could take a fresh signal that earned +$1,540.35. The simple version was already holding and could not.
Fees fell with the trade count, from $423.24 to $354.99, and time in market dropped from 16.15% to 12.21%. Both versions still lost money in 2026: the shared trade entered on 2026-01-31 was the worst trade of the complex version at -$2,130.55, so the filters did not protect against every failed bounce.
What This Test Cannot Tell You
This matched test shows the combined effect of adding RSI(14) below 40 and ATR(14) above its average, not what either filter does alone. Four limits apply:
No per-filter attribution. With both filters added at once, there is no way to tell whether RSI, ATR or their combination removed the June 2022 loss.
Small trade counts. The two versions made only 13 and 17 trades, too few to separate skill from luck. One trade can flip the ranking: the complex version's +$1,540.35 trade on 2022-01-21 is larger than its whole $932.46 final-balance lead.
One asset, one window. The result is for BTCUSDT daily from August 2021 to August 2026 only. A different window could reward different trades.
Timing side effects. One profitable trade existed only because the complex version happened to be flat.
So the honest answer to "do more indicators improve a strategy?" from this test is narrower than a yes: two filters made this strategy trade less, draw down less and finish higher on this window, for reasons that sit in six trades. Treat it as a lead to test, not a rule to adopt.
How to Attribute Changes Rule by Rule
Knowing which filter did the work takes separate runs, not one combined run. Every step below is a backtest you can repeat in CoinQuant:
Step 1: keep the base strategy fixed: same entry trigger, exit, asset, timeframe, window, capital and fee
Step 2: add one filter at a time and run each version on the identical settings
Step 3: compare the trade logs, not only the headline metrics, and list which trades each filter removed
Step 4: fix filter values before running, then check the result on a second window or asset before trusting it
For the wider method of stacking indicators without curve-fitting, see How to Combine Multiple Indicators Without Overfitting Your Strategy. For the case for keeping rules minimal, see Simple Crypto Trading Strategy That Actually Works (Backtested).
The Practical Lesson
In a matched daily Bitcoin test from August 2021 to August 2026, adding two entry filters raised the return from +30.73% to +40.06% and cut the maximum drawdown from 38.13% to 24.18%
The complex version traded less (13 trades against 17) and paid less in fees
Neither version matched buy and hold's +57.33% return, but both avoided its 76.63% drawdown
The improvement rests on a handful of trades, including one the filters made possible through timing, so treat it as a lead to test further
A simple vs complex trading strategy decision should come from runs like these rather than from the number of indicators on a chart. CoinQuant, an AI trading platform, supports multi-indicator conditions on one entry, which makes the add-one-filter-at-a-time test quick to set up.
Build trading strategies on real data. No coding required.
Add or remove one filter and compare. Run this backtest free on CoinQuant
Disclaimer:
Key Takeaway
