
Maximum Drawdown in Crypto Trading: How to Read It and Why It Matters More Than Returns

A strategy can double your account and still lose you as a trader. The number that decides whether you survive to enjoy the return is not the return at all. It is the maximum drawdown.
Drawdown is the distance from a high point in your equity to the low point that follows. Maximum drawdown is the worst such distance in the whole test. It is the single most important risk number on any backtest report, and it is the one most readers skip.
This guide explains what maximum drawdown actually measures, how to read it on a CoinQuant report, and how to use it to size positions you can actually hold.
What Maximum Drawdown Actually Measures
Drawdown is measured from a peak, not from your starting balance. If your account runs from $10,000 to $20,000 and then falls to $12,000, your drawdown is 40%, because the fall is measured from the $20,000 peak.
Two consequences follow, and both surprise new traders:
A profitable strategy still has a drawdown, sometimes a large one. Drawdown is about the path, not the destination
The starting balance is not a floor. A strategy that is up 100% can still give back half before the next high
Maximum drawdown takes the worst of these peak-to-trough declines across the entire test period. It is a historical fact about the strategy, not a forecast, and its value is that it shows what holding the strategy would have felt like at the worst moment.
Why Drawdowns Are Asymmetric
Recovering from a drawdown takes a larger percentage gain than the percentage you lost. That asymmetry is the reason drawdown matters more than most traders expect.
| Drawdown | Gain needed to recover |
|---|---|
| 10% | +11.1% |
| 20% | +25.0% |
| 30% | +42.9% |
| 50% | +100.0% |
| 76.63% | +327.9% |
Read the bottom row again. After a 76.63% drawdown, a strategy needs a gain of nearly 328% just to get back to even. This is why deep drawdowns are not just uncomfortable. They change the mathematics of everything that follows.
What Counts as a Bad Drawdown in Crypto
There is no universal threshold, because the honest benchmark is context:
Crypto buy and hold routinely draws down 70% or more. The tested BTC buy and hold baseline in the CoinQuant library, covering August 2021 to August 2026, carried a maximum drawdown of 76.63%
Trend-following strategies often run 30% to 50% drawdowns even when the return is strong, because they accept whipsaws as a cost of catching large moves
Mean reversion and lower-exposure strategies can stay under 25%. The tested BTC RSI(14) mean reversion strategy in the same library showed a maximum drawdown of 23.19% over the same window
Same market, same five years, dramatically different survival profiles. The drawdown tells you which profile you are signing up for.
How to Read Drawdown on a CoinQuant Report
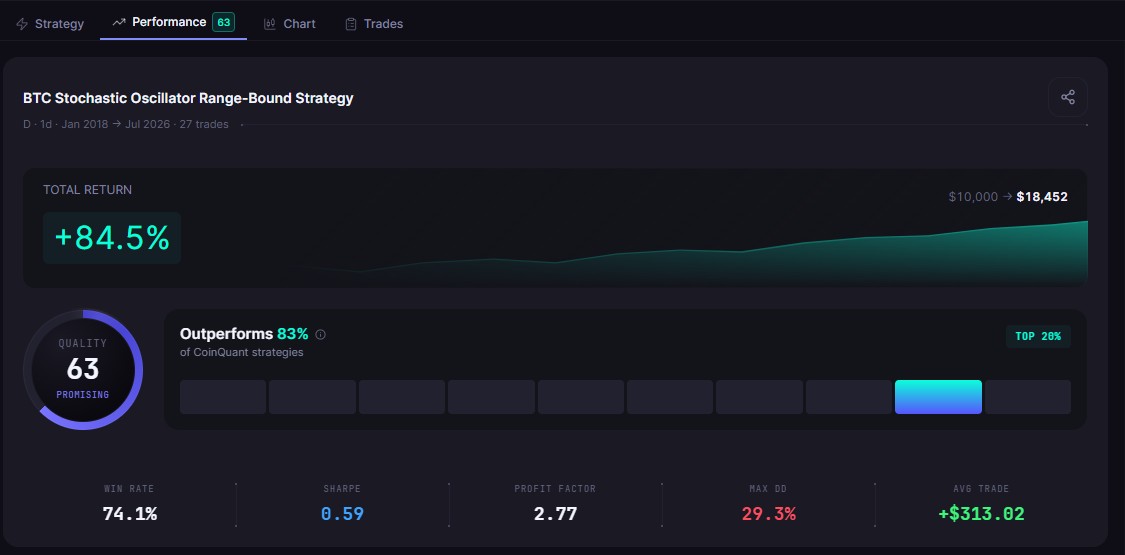
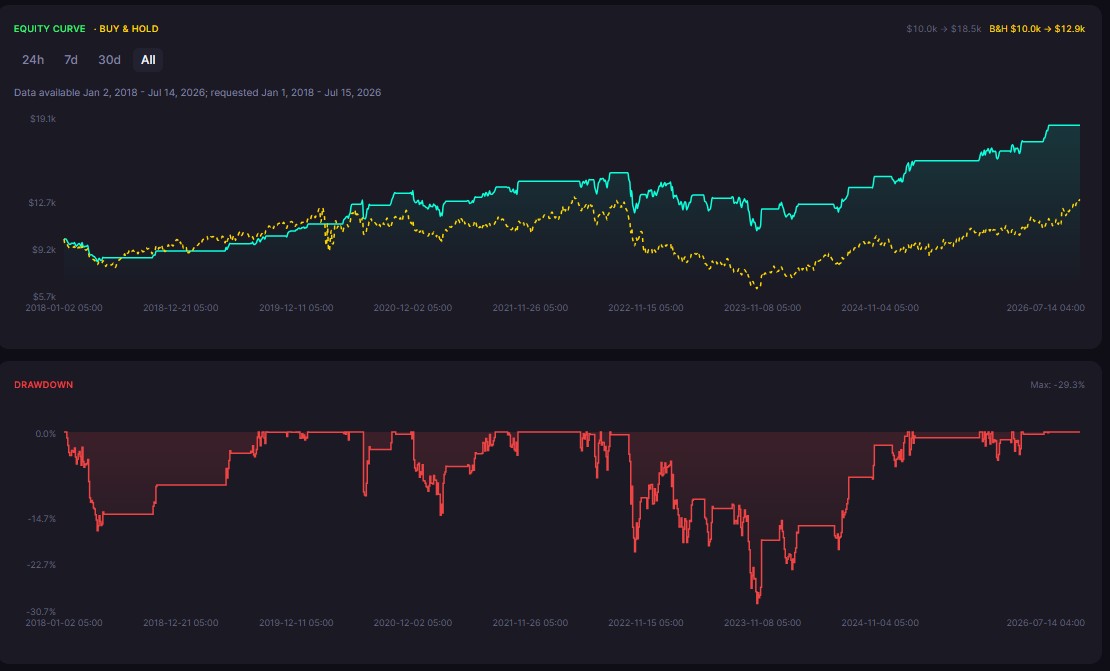
Every CoinQuant backtest reports maximum drawdown next to the return metrics, and the equity curve shows where it happened. Three habits turn the number into a decision.
First, locate the drawdown in time. Find the equity curve's deepest valley and look at what the market was doing. A drawdown that happened during a market-wide crash is a different proposition from one caused by the strategy itself.
Second, pair it with trade count. A 30% drawdown across 60 trades is a measured cost. A 30% drawdown across four trades is a warning that the sample is small.
Third, compare it with time in market. A strategy that draws down 30% while exposed only 25% of the time is taking concentrated risk when it trades. A buy and hold at 100% exposure earned its drawdown the hard way.
How to Use Drawdown to Size Your Risk
The practical power of maximum drawdown is that it converts directly into position sizing. Four rules cover most of it:
Set your survivable number first. Decide the drawdown you could sit through without breaking your process, before considering any strategy. That number is personal, and it is usually smaller than people think
Scale exposure to the historical drawdown. If a strategy's worst historical drawdown is twice what you can tolerate, halving position size roughly halves the drawdown, and roughly halves the return with it
Prefer the better ratio. Two strategies with similar returns are not equal if one drew down 25% and the other 50%. The calmer path compounds, and it does not force you out at the bottom
Treat the number as a floor, not a ceiling. The next drawdown can exceed history. Sizing should assume it will
The Report Comparison That Makes It Concrete
One comparison, from real tested results on the same BTC window (August 2021 to August 2026), shows why this metric belongs next to returns on every report:
| Strategy tested | Total return | Max drawdown |
|---|---|---|
| BTC Buy and Hold 1D 2021-2026 | +57.33% | 76.63% |
| BTC RSI(14) Mean Reversion 1d | +55.69% | 23.19% |
The buy and hold made slightly more in headline return and took more than three times the drawdown to get there. For most traders, the second row is the more investable profile, and you can only see that by reading both numbers together.
Both of those tests are also easy to describe in plain English, exactly as you would type them into the CoinQuant builder. The RSI row above comes from: "Buy BTC when RSI(14) crosses below 30, and exit when it crosses above 50." The buy and hold row is a single entry held to the end of the period. Same market, same years, and a 53-point gap in maximum drawdown between two sentences.
Common Mistakes to Avoid
Reading returns first. Drawdown is the number that decides whether you can hold the strategy at all
Comparing drawdowns across different windows. A 20% drawdown in a calm year and a 20% drawdown through a crash are different feats
Ignoring recovery math. Deep holes need disproportionate gains, and that changes compounding
Sizing from optimism. Size from the worst historical drawdown, then add margin, not the reverse
Chasing zero drawdown. Every strategy that takes risk has drawdowns. The goal is one you can survive, not one that does not exist
The Practical Lesson
Maximum drawdown is the worst peak-to-trough decline in the test, measured from highs, not from your deposit
Recovery is asymmetric: a 76.63% drawdown needs a +327.9% gain to undo
Context decides what counts as bad: 76.63% for tested BTC buy and hold against 23.19% for the tested RSI mean reversion strategy over the same window
Used correctly, the number sizes your positions and sets your expectations before any money moves
Returns describe the reward. Drawdown describes whether you get to keep it. Read both on every report, and let the second one set your size.
Backtest your strategy free and read its full risk profile on CoinQuant. Start your first backtest on CoinQuant
Disclaimer:
Key Takeaway
