
How Much Historical Data Do You Need for a Reliable Crypto Backtest?
A backtest is only as meaningful as the history it covers. Too little data and any rule looks plausible, because the sample is one market mood. The reliable number depends on the strategy's timeframe, and there is a tested answer for each one in the CoinQuant library evidence.
This guide explains how much historical data different strategies need, with verified examples from the library's timeframe matrix, out-of-sample window, and five-year runs.
The Core Rule: Cover a Full Cycle
The minimum requirement is not a number of years, it is regime coverage. A reliable crypto backtest needs at least one complete cycle: a bull phase, a bear phase, and a range phase. On Bitcoin, that means the 2021 bull, the 2022 bear, and the 2023-2026 recovery and range.
The reason is mechanical. A strategy that only saw an uptrend will look profitable no matter how bad its logic is, because everything long-only wins in an uptrend. The 2022 bear market is the filter that separates rules with an edge from rules that were just long during a rally.
The Timeframe Matrix
The verified library evidence includes the same RSI(14) mean reversion rules tested across six timeframes on Bitcoin, which shows how the required window scales with the strategy's speed:
| Timeframe | Backtest window | Trades | Total return |
|---|---|---|---|
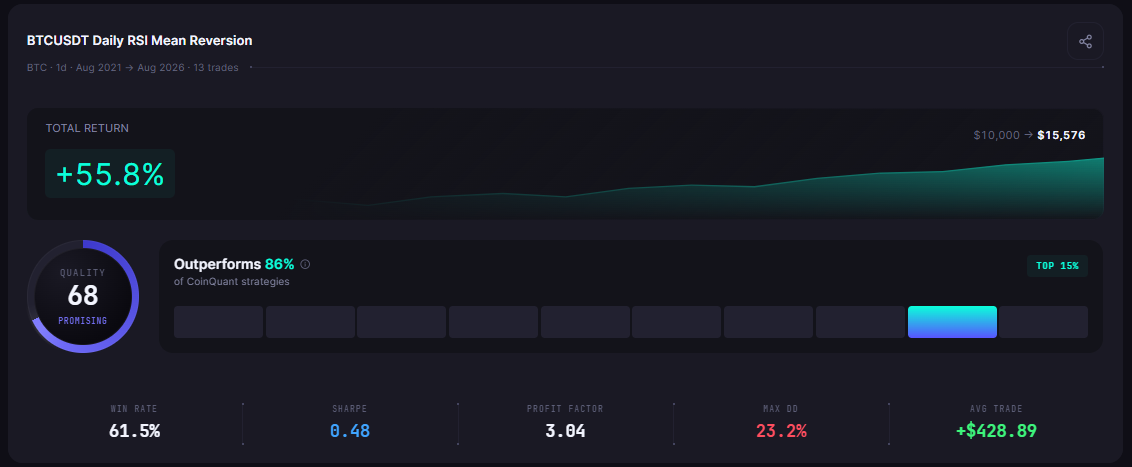
| 1D | Aug 2021 to Aug 2026 (5 years) | 13 | +55.76% |
| 4H | Aug 2024 to Aug 2026 (2 years) | 33 | -9.26% |
| 1H | Aug 2025 to Aug 2026 (1 year) | 72 | -32.98% |
| 15m | Jan 2026 to Aug 2026 (8 months) | 138 | -31.36% |
| 5m | Apr 2026 to Aug 2026 (5 months) | 235 | -38.35% |
| 1W | Aug 2021 to Aug 2026 (5 years) | 1 | -10.62% |
The pattern is the point of the matrix. Daily data over five years produced 13 trades and a positive result. The same rules on 5-minute data over five months produced 235 trades and a deep loss. Faster timeframes generate more trades per day, which means they need less wall-clock time to build a sample, and they also inherit more noise.
Practical Window Guidelines
The library evidence supports these rules of thumb:
Daily and weekly strategies: 3 to 5 years minimum, enough to cover the 2021 bull, the 2022 bear, and the recovery
4-hour strategies: 2 to 3 years, which on Bitcoin covers the 2024 and 2025 cycles
1-hour strategies: 1 to 2 years
15-minute and faster: 6 to 12 months of continuous data, with the caveat that intraday noise and fees dominate the result
The single most important guideline: the window must include a bear market. A backtest that starts after a crash and ends at a high is a bull-market test wearing a lab coat.
The Out-of-Sample Requirement
Historical coverage is not just about length, it is about separation. The reliable workflow splits the data: an in-sample window for designing the strategy, and an out-of-sample window the strategy never saw during design.
The library's out-of-sample evidence used a January 2023 to 2026 window for validation, after the strategy was designed on earlier data. The point of the split is that the out-of-sample result is the only one that measures the strategy rather than the fitting process. A strategy whose out-of-sample results are close to its in-sample results has evidence. One whose edge collapses out-of-sample has a fitted curve.
What Different Windows Are For
The matrix also shows that windows have jobs, not just lengths:
5 years: the reliability window. This is where a strategy earns the right to be called tested, because it has seen a full cycle
2 to 3 years: the development window. Enough for intraday and 4-hour strategies to show their behavior across a rally and a correction
12 months: the diagnostic window. Useful for checking a specific regime, and useless for claiming a strategy works
1 to 6 months: the smoke test. Only valid for measuring behavior, never for judging an edge
Most failed strategies were judged on a smoke test window and deployed as if the result were a five-year verdict. The label on the window is the discipline: name the window's job before running it, and never let a diagnostic window produce a deployment decision.
The Long-Horizon Benchmark
For context on the upper end of the range, the library's long-term evidence includes five-year dollar-cost averaging runs on Bitcoin, and the five BTC 1D family strategies backtested from January 2021 to August 2026. The five-strategy set is the practical demonstration of what a 5.6-year window buys: it contains the 2022 crash, and every strategy in the set lost money in at least one year, which is exactly the information a short window hides.
Common Data Mistakes
Testing on one regime. A 12-month uptrend window makes any long-only rule look like a winner
Testing too little data for the timeframe. Five months of 5-minute data is 235 trades, which is a sample, but one that only saw one market mood
Testing too much data for the strategy's life. A rule designed on 2024 data and backtested back to 2017 can look great for reasons that no longer exist
Reusing the same window for design and judgment. Without an out-of-sample split, the result is inflated by construction
The Practical Lesson
Regime coverage beats raw length. One full cycle is the minimum, bull, bear and range
Timeframe decides the number. Daily needs 3 to 5 years, intraday needs less wall-clock time but more noise management
Out-of-sample is the reliability test. The split window is what separates a strategy from a fitted curve
The library matrix is the reference. The same rules across six timeframes and windows show exactly how data length changes both the sample and the verdict
The next step is practical: take your strategy, run it on the longest window your plan supports, and compare it with an out-of-sample split before you trust the result.
Test your strategy on years of data free
Disclaimer:
Key Takeaway