
What Is the Sharpe Ratio in Crypto? A Trader's Guide to the #1 Backtest Metric

The Sharpe ratio is the most important single number in a crypto backtest report. Not because it tells you everything, but because it answers the question that total return alone cannot: was the return worth the risk it took to achieve it?
Sharpe ratio in crypto trading explained simply: it measures how much return you earned per unit of volatility. A strategy that returned the same amount with half the volatility has twice the Sharpe ratio. Higher is better, but context always matters.
If you have run a backtest on CoinQuant or any other platform and found the Sharpe ratio column, this guide explains what it means, how to interpret it, and what to do when yours is too low.
The Sharpe Ratio Formula, Without the Maths Degree
The full formula involves standard deviation of returns and a risk-free rate, but the practical interpretation is simpler than the formula suggests.
Think of it this way:
A Sharpe ratio above 1.0 means the strategy is returning more than one unit of gain for each unit of risk it takes. Acceptable.
A Sharpe ratio above 2.0 means the returns are strong relative to the volatility involved. Good.
A Sharpe ratio below 0.5 means the strategy is taking on a lot of volatility relative to the return it generates. Weak.
A negative Sharpe ratio means the strategy is losing money. The risk-free rate would have served better.
In crypto specifically, the benchmark for "good" is different from traditional markets. Crypto assets are inherently more volatile than stocks or bonds, which pushes Sharpe ratios lower across the board. A Sharpe ratio that would be mediocre in a stock strategy might represent a genuinely strong result in a crypto context.
What a Good Sharpe Ratio Looks Like in Crypto
This is the question most traders ask first, and the answer depends on what you are comparing.
| Sharpe Ratio Range | What It Typically Means in Crypto |
|---|---|
| Above 2.0 | Excellent. Very strong risk-adjusted return. |
| 1.0 to 2.0 | Good. Strategy is delivering meaningful return for the risk taken. |
| 0.5 to 1.0 | Acceptable. Worth examining, especially alongside other metrics. |
| Below 0.5 | Weak. High volatility relative to returns. |
| Negative | Strategy is losing money on a risk-adjusted basis. |
One important caveat: a high Sharpe ratio in a backtest does not guarantee a high Sharpe ratio in live trading. If the backtest parameters were over-fitted to historical data, the ratio will deteriorate when the strategy runs on new data.
This is why looking at the Sharpe ratio across different time periods matters. If your strategy shows a strong ratio in a bull market period but a negative ratio in a range or bear period, it is not as robust as the best number suggests.
Why the Sharpe Ratio Matters More in Crypto Than in Stocks
Crypto assets move differently from equities. Intraday swings are larger. Market regime changes are sharper. A bull run that took traditional markets years to build can occur in crypto in weeks, and reversals can be equally abrupt.
This higher volatility makes the Sharpe ratio harder to achieve in crypto than in stock strategies. A ratio of 1.5 in a crypto backtest reflects genuinely disciplined risk management. A strategy that produces a low Sharpe ratio might still be profitable in raw return terms, but it is taking on more volatility than the return justifies.
The Sharpe ratio is the corrective. It forces you to ask whether the returns you see are coming from sound strategy logic, or from taking on volatility and getting lucky during a favorable period.
The Sharpe Ratio Alongside Other Backtest Metrics
No single metric tells the full story. The Sharpe ratio is the starting point, but it should always be read alongside:
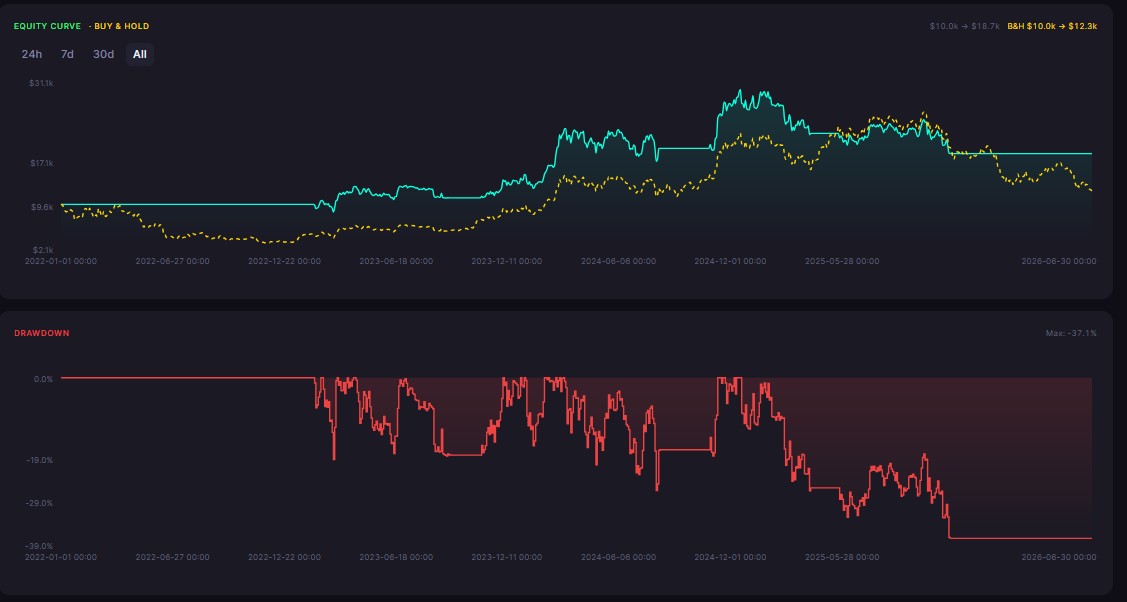
Max drawdown. The Sharpe ratio does not tell you how bad the worst losing period was. A strategy with a 1.2 Sharpe ratio and a 60% max drawdown is very different from one with a 1.2 Sharpe ratio and a 15% max drawdown. Most traders cannot psychologically survive the former.
Win rate. A high Sharpe ratio with a low win rate means the strategy has a few large winners that carry the overall result. A high Sharpe ratio with a high win rate is more consistent and typically easier to execute with discipline.
Profit factor. Profit factor is gross profit divided by gross loss. A profit factor above 1.5 alongside a Sharpe ratio above 1.0 is a strong combination. They are measuring different things and cross-validate each other.
Number of trades. A Sharpe ratio calculated on five trades is statistically meaningless. A strategy needs a sufficient number of trades over a meaningful period for the ratio to be reliable.
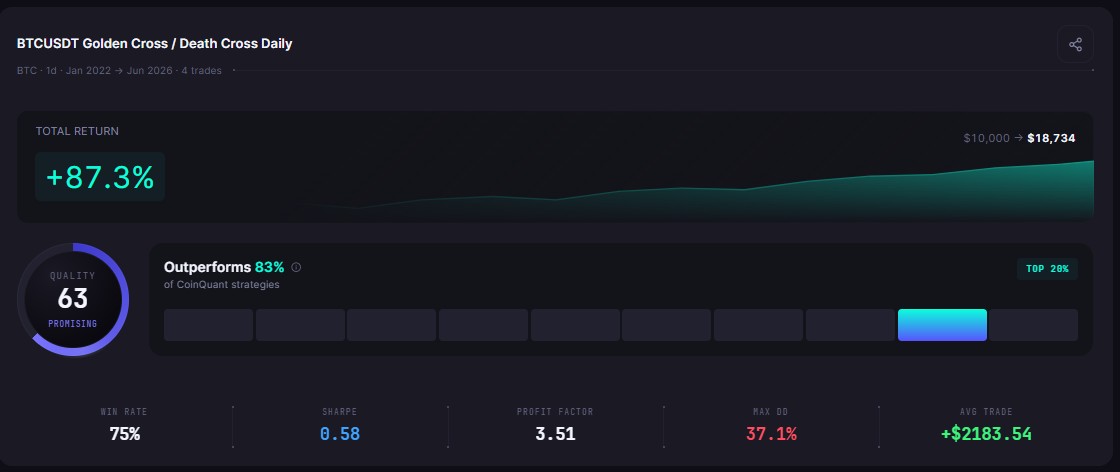
CoinQuant displays all of these metrics in the same results panel, so you can evaluate them together without switching between tools.
How CoinQuant Shows You the Sharpe Ratio
When you run a backtest on CoinQuant, the results include the Sharpe ratio as a standard output. You do not need to calculate it manually or export data to a spreadsheet.
The results panel shows:
Sharpe ratio
Total return
Max drawdown
Win rate
Profit factor
Total number of trades
Each of these is calculated against the full backtest period you set, using real historical data from Kaiko (for crypto assets) with fees and slippage included.
The inclusion of fees matters because it affects the Sharpe ratio. A strategy that looks strong before fees may look weaker after, particularly for high-frequency strategies that generate many trades. CoinQuant's default inclusion of fees gives you a realistic result rather than an idealized one.
What a Low Sharpe Ratio Tells You About Your Strategy
A Sharpe ratio below 0.5 is not a reason to abandon the strategy outright, but it is a signal to investigate. The most common causes:
High volatility, low return. The strategy takes large swings in equity without capturing enough return. Consider tightening stop-loss levels or adding a trend filter.
Too many trades. High trade frequency in a volatile market accumulates fees that eat into the ratio. Reduce entry frequency or raise the entry threshold.
Single market regime tested. A strategy optimized for a trend will show a poor Sharpe ratio in a range. Extend the test period to cover multiple regimes.
Over-fitting. If you have adjusted the strategy heavily to match past data, the ratio looks good historically but will not hold in live trading.
A low Sharpe ratio is a diagnostic, not a verdict. It tells you something specific is wrong with the risk-to-return balance.
Common Sharpe Ratio Mistakes Traders Make
Comparing crypto Sharpe ratios to stock benchmarks. A 0.8 Sharpe ratio in crypto is not the same as a 0.8 in a US equity strategy. Different volatility environments require different benchmarks.
Treating the backtest Sharpe ratio as a prediction. It is a description of historical behavior, not a guarantee of future results. Use it as a comparison and hypothesis-testing tool, not a performance forecast.
Ignoring the calculation period. A Sharpe ratio from a three-month backtest is far less reliable than one from a three-year backtest. More data means more confidence in the ratio.
Optimizing solely to improve the Sharpe ratio. Adjusting parameters specifically to maximize the ratio on historical data leads to over-fitting. The metric should emerge from a sound strategy, not be engineered directly.
See your strategy's Sharpe Ratio - backtest free on CoinQuant
Disclaimer:
Key Takeaway
