
Ethereum Buy and Hold vs a CCI Momentum Rule: Five Years Tested (2021-2026)

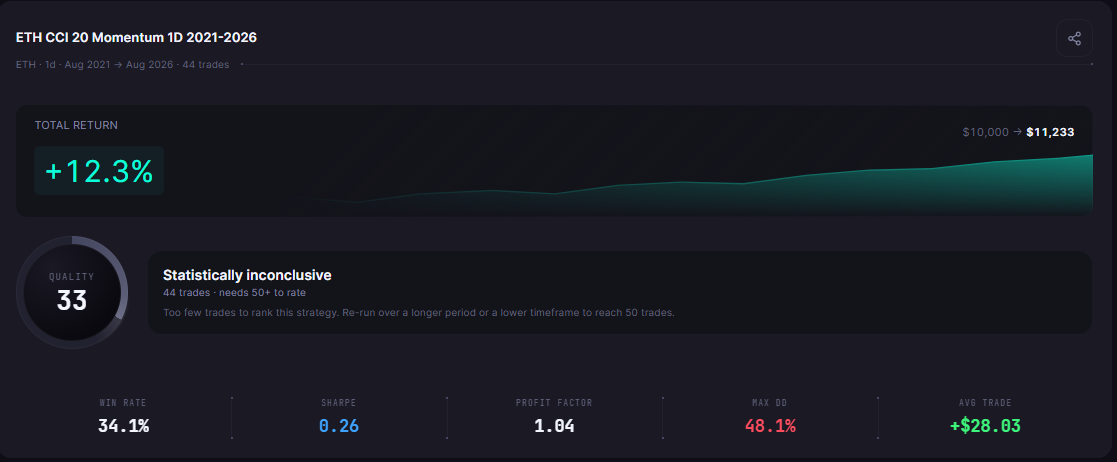
Should you buy and hold Ethereum, or follow a rule? From August 2021 to August 2026, Ethereum buy and hold turned $10,000 into $7,205.03, a Total Return of -27.95%. A simple CCI momentum strategy on the same daily ETH candles ended at $11,233.19, a Total Return of 12.33% across 44 trades, in backtests the author ran on CoinQuant.
The rule also had the shallower worst fall: a Max Drawdown of 48.13%, against 79.30% for holding. That still means the account lost almost half of its peak value at one point. And 44 trades are too few for the results card to rate, so it marks the run "Statistically inconclusive".
Both runs pay a 0.1% fee on every entry and exit, with no slippage modelled. This article reports the results without adjustment. No tuned parameters, no cherry picked dates.
Ether's October, as Dated Context
Ether had a weak October 2026. Binance's ETHUSDT monthly candle for October 2026 (UTC) opened at 2,686.01 and closed at 2,255.66, a fall of 16.02% from open to close. On that measure it was the weakest of the ten Octobers from 2017 to 2026; the strongest was October 2021, at 42.88%.
The five year test below ends on 1 August 2026, so it does not include October 2026. The October candle is background for the question many ETH holders ask after a month like that, not part of the result.
The Rule and the Settings
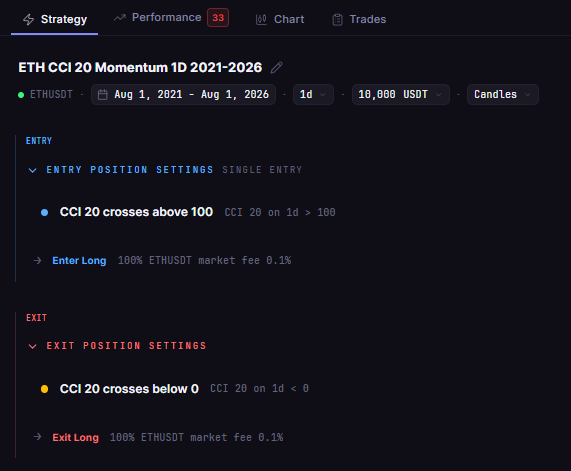
The rule buys ETH when the 20 day Commodity Channel Index (CCI) crosses above 100 and sells when it crosses back below 0. There is no stop and no profit target. It holds one position at a time and never shorts.
| Parameter | Setting |
|---|---|
| Strategy | ETH CCI 20 Momentum 1D 2021-2026 |
| Instrument | ETHUSDT (spot, Binance) |
| Data source | Kaiko via CoinQuant |
| Timeframe | Daily (1D) |
| Tested window | 2021-08-01 to 2026-08-01 |
| First trade to last exit | 2021-08-13 to 2026-07-31 |
| Entry | CCI (period 20) crosses above 100 |
| Exit | CCI (period 20) crosses below 0 |
| Direction | Long only, no leverage, one position at a time |
| Initial capital | $10,000 |
| Position size | 100% of equity per entry |
| Fees | 0.1% taker fee on entry and on exit (fees included, no slippage modelled) |
| Baselines (same window) | ETH Buy and Hold 1D 2021-2026; BTC Buy and Hold 1D 2021-2026 |
The Strategy tab shows the stored rule as two lines, the entry listed above the exit. It lets you check that the stored rule matches the entry and exit in the table.
Result and Ethereum Buy and Hold Comparison
The table sets the CCI rule against Ethereum buy and hold and, as the BTC Spot Comparison, against holding Bitcoin over the same five years.
| Metric | CCI 20 rule | ETH Buy and Hold | BTC Spot Comparison |
|---|---|---|---|
| Strategy | ETH CCI 20 Momentum 1D 2021-2026 | ETH Buy and Hold 1D 2021-2026 | BTC Buy and Hold 1D 2021-2026 |
| Total Return | 12.33% | -27.95% | 57.33% |
| Final Balance | $11,233.19 | $7,205.03 | $15,733.43 |
| Total Trades | 44 | 1 | 1 |
| Win Rate | 34.09% (15W / 29L) | n/a (single hold) | n/a (single hold) |
| Profit Factor | 1.04 | n/a (single hold) | n/a (single hold) |
| Sharpe Ratio | 0.26 | 0.26 | 0.44 |
| Max Drawdown | 48.13% | 79.30% | 76.63% |
| CAGR | 2.35% | -6.34% | 9.48% |
| Total Fees | $1,007.59 | $17.20 | $25.74 |
All three runs share the window, capital, sizing and 0.1% fee on entry and exit. A Profit Factor of 1.04 means the winning trades made $1.04 for every $1 the losing trades lost, after fees. CAGR is the steady yearly rate that reaches the same final balance: 2.35% a year for the rule, -6.34% for holding ETH.
The rule beat holding ETH on Total Return and Max Drawdown. Its Sharpe Ratio, though, was level with holding at 0.26, so the extra return did not come with a smoother ride per unit of volatility. Holding Bitcoin beat both over this window, at 57.33%.
Each hold is a single trade, which makes it a baseline, not a sample. On the Performance tab, the rule's results card shows its QUALITY number, 33, next to "Statistically inconclusive" (44 trades · needs 50+ to rate).
In and Out During the Big Falls
Holding ETH took the whole slide from the late 2021 peak. The hold's worst drawdown ran from 8 November 2021 to 18 June 2022 and reached 79.30% of its peak value.
The rule sat out most of that slide. By our arithmetic on its trade log (UTC dates), the rule held ETH at the daily close on only 109 days of 2022. The seven trades it closed that year (grouped by exit date) lost a net $1,405.93 after fees, a small dent next to the hold's fall.
Its own worst stretch came later. The rule's equity peaked at $20,292.60 on 22 August 2025 and fell to $10,525.68 by 8 July 2026, which is the 48.13% Max Drawdown in the table. Seven of the nine trades the rule entered from September 2025 on lost money.
| Period or trade (UTC) | What the rule's trade log shows |
|---|---|
| 2022, seven trades closed | Net -$1,405.93 after fees; ETH held on 109 days |
| Best trade, 2024-02-08 to 2024-03-16 | Net $4,804.66 after fees |
| Worst trade, 2025-10-06 to 2025-10-10 | Net -$2,993.64 after fees (entry 4,684.01, exit 3,829.72) |
| 2026 to the end of the test, six trades closed | Net -$1,719.90 after fees |
Stepping aside spared most of the 2022 damage, but a run of losing trades gave back almost half of the account's August 2025 peak value. For more on reading that number, see how to read Max Drawdown in crypto trading, and why it matters more than returns.
What CCI Measures
CoinQuant's Supported Elements page puts it plainly: "CCI (created by Donald Lambert) measures the distance between the current price and its average price, scaled by how much price normally varies." The same page adds: "When price is far above its average, CCI is high and positive; when far below, CCI is deeply negative."
That makes a cross above 100 a sign that price has pushed well above its 20 day average, which this rule reads as momentum. A drop below 0 means price is back under its average, so the rule steps out. CCI can also be traded the other way, buying low readings in a range: see a CCI trading strategy backtest on Bitcoin as a range oscillator.
For other ways to trade Ether, from trend rules to oscillators, see Ethereum Trading Strategy: 5 Approaches Backtested (2026).
Why 44 Trades Is Not Enough to Rate
CoinQuant's results card rates a run against other strategies only from 50 trades up. With 44, the card shows the QUALITY number, 33, next to "Statistically inconclusive" (44 trades · needs 50+ to rate).
It matters here because a few trades carry the result. The best trade alone made $4,804.66, more than the rule's whole net gain of $1,233.19, so the other 43 trades together lost money after fees. With a Win Rate of 34.09%, the rule relies on an average win of $1,939.35 outweighing an average loss of $960.59.
A result that rests on one or two trades can flip with one missed signal. For why 50 trades is a sensible floor, see How Many Trades Does a Backtest Need Before You Can Trust It?
What This Test Cannot Tell You
This is one coin, one rule and one window on daily bars. A different threshold, period or coin could behave very differently.
- Costs: fees included, no slippage modelled. Each trade pays 0.1% on entry and 0.1% on exit, $1,007.59 in total for the rule.
- Direction: long only, one position, no leverage. The rule never shorts the falls it sits out.
- Window: 2021-08-01 to 2026-08-01. The test says nothing about ETH after that date, October 2026 included.
- Sample: 44 trades, below the 50 the card needs to rate the run.
- Rule design: CCI(20) with lines at 100 and 0, fixed in advance. Other settings are other rules, with their own results.
Past results do not predict future results. For the wider question of trading against holding, see active trading vs buy and hold in crypto.
The Practical Lesson
- Holding lost money here: Ethereum buy and hold returned -27.95% from 2021-08-01 to 2026-08-01, with a 79.30% Max Drawdown.
- The rule stepped aside: 12.33% and a 48.13% Max Drawdown, after $1,007.59 in fees.
- The sample is small: 44 trades, "Statistically inconclusive" on the card, and one trade made more than the whole net gain.
Treat the CCI rule as a starting point to test further, not a verdict. In CoinQuant, an AI trading platform, you describe a rule like this in plain words with no coding required, then test it on other coins, windows or thresholds to see whether the edge holds.
Build trading strategies on real data. No coding required.
Frequently Asked Questions
Should I buy and hold Ethereum?
This test cannot decide that for you. From 2021-08-01 to 2026-08-01, holding ETH returned -27.95%, while a CCI 20 rule returned 12.33% across 44 trades, a sample too small to rate. Holding Bitcoin returned 57.33% over the same window.
What is a CCI momentum strategy?
It buys when the Commodity Channel Index shows price pushing well above its average, here a cross above 100 on CCI(20), and exits when that push fades, here a cross below 0. It follows strength rather than buying low readings.
Does this test include October 2026?
No. The backtest ends on 1 August 2026, so ETH's October 2026 fall (16.02% on the Binance monthly candle, open to close) is not in it.
Test the CCI rule on your own coin and window, with fees included.
Disclaimer:
Key Takeaway