
How Many Trades Does a Backtest Need Before You Can Trust It?

How many trades for a backtest is enough? The honest answer is "more than you might think". The rule of thumb in CoinQuant's own overfitting guide is at least 30 trades, ideally 100 or more, before you trust any single metric. Below that, one good or bad trade can change the whole result.
This guide shows why with a real result from a CoinQuant strategy library: a Bitcoin trend strategy that made three trades and reports a Profit Factor of 20.11. It looks brilliant, and it proves very little.
You will learn a quick way to estimate a strategy's sample size before you run it, why trades need to spread across market regimes and how to raise the sample without loosening your rules.
How Many Trades for a Backtest? The Short Answer Depends on the Strategy
CoinQuant's guide on how to know if your trading strategy is overfit gives the rule this article builds on: "Require at least 30 trades, ideally 100+, before trusting any metric". It is a sensible floor, not a law of statistics. CoinQuant's results card sets a higher bar: below 50 trades it labels a run "Statistically inconclusive" and shows "needs 50+ to rate".
The right backtest sample size depends on how often the strategy trades. A fast strategy on hourly bars can pile up trades quickly. A slow trend filter on daily bars may need many years of data to reach 30.
That leads to the key point: if a slow strategy has too few trades, the fix is more data, not looser rules. Changing the rules to trade more often creates a different strategy, with its own sample to judge.
Why a Tiny Sample Can Look Brilliant
The example is AI EMA 50/200 1D Trend Strategy, a long-only Bitcoin rule tested on daily BTCUSDT from 2021-01-01 to 2026-08-01 with a 0.1% fee. In plain English, the rule reads:
Buy BTCUSDT on the daily chart when the 50-period EMA crosses above the 200-period EMA. Sell when the 50-period EMA crosses back below. Test from January 1, 2021 to August 1, 2026 with $10,000, 100% of equity per trade and a 0.1% fee.
| Metric | Result |
|---|---|
| Strategy | AI EMA 50/200 1D Trend Strategy |
| Total Trades | 3 |
| Total Return | 216.65% |
| Profit Factor | 20.11 |
| Win Rate | 66.67% (2W / 1L) |
| Max Drawdown | 49.46% |
| Sharpe Ratio | 0.74 |
| Total Fees | $78.34 |
A Profit Factor of 20.11 means gross profits were about 20 times gross losses. With three trades, that figure comes from just one loss of 11.34% after fees, one small gain of 6.36% and one very large gain of 235.79%, held from 2023-10-03 to 2025-11-17.
That last trade alone made 102.63% of the strategy's net profit, so the other two trades lost money in total. Add one more loss the size of the first and the Profit Factor would roughly halve, while the Win Rate would fall to one in two. For how each metric is calculated, see how to read backtest results.
On the Performance tab, check the trade count before anything else. Here the results card shows "3 trades · needs 50+ to rate" and marks the run "Statistically inconclusive", even with a Profit Factor of 20.11 on the same card.
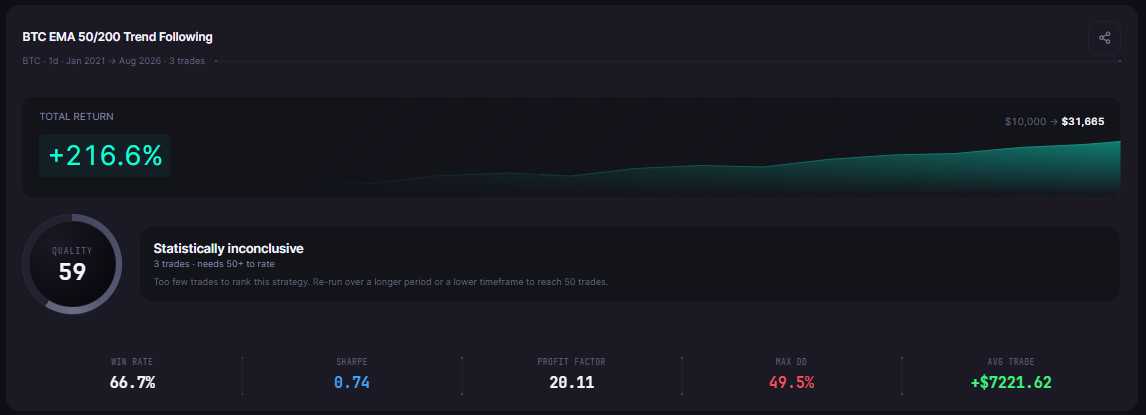
AI EMA 50/200 1D Trend Strategy on daily BTCUSDT, 2021-01-01 to 2026-08-01: a Profit Factor of 20.11 and a Total Return of 216.65% from only three trades.
The same result has appeared in an earlier comparison of EMA 20/50 vs EMA 50/200 on Bitcoin. It is used here only to show how fragile a three-trade sample is.
Trades per Year Times Years: Estimate the Sample First
You can estimate the trade count before you run a single test. Multiply how often the strategy is likely to trade by the number of years you plan to test.
- Estimate trades per year: look at how slow the signal is. A 50/200 moving average cross on daily bars changes direction rarely, while a short oscillator on hourly bars fires often.
- Multiply by the years of data: this gives a rough expected sample before you test anything.
- Compare it with your target: if the estimate is below 30, plan a longer window, more assets or a lower timeframe before you start.
- Run the test and check the real count: read Total Trades first, then the rest of the results.
The example strategy traded 0.54 times a year, about once every two years. At that pace, reaching 30 trades on one coin would take decades of daily data, which no crypto market has.
The rules explain why. Both averages are long, so they cross rarely: the first trade only arrived on 2021-08-14, more than seven months into the test window.
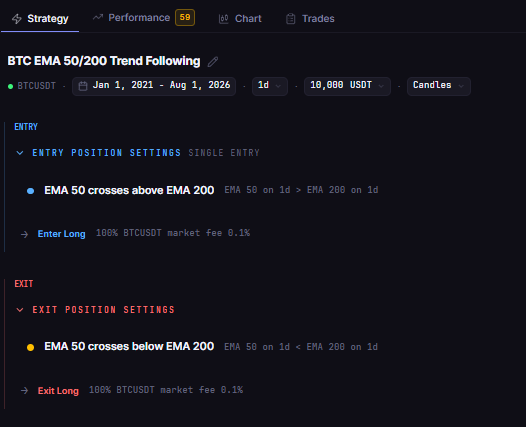
The rules of AI EMA 50/200 1D Trend Strategy: enter when the 50-period EMA crosses above the 200-period EMA and exit on the cross below, which is why it trades so rarely.
Count Trades per Market Regime, Not Just in Total
Thirty trades all taken in one bull run still tell you only how the rule behaves in a bull run. A trustworthy sample has trades in rising, falling and sideways stretches.
The example shows the problem in miniature. Its three trades fell in three quite different stretches of the market:
- Trade 1 (2021-08-14 to 2022-01-10): bought during the 2021 bull market and closed down 11.34% after fees as prices fell into early 2022.
- Trade 2 (2023-02-18 to 2023-09-24): an early recovery trade that gained 6.36% after fees.
- Trade 3 (2023-10-03 to 2025-11-17): one long hold through the 2024 to 2025 advance, up 235.79% after fees.
One trade per regime cannot tell you how the rule handles any of them. Before you trust a result, count how many trades fall in each stretch. For how far back to go, see how much historical data you need for a reliable crypto backtest.
How to Raise the Sample on CoinQuant
CoinQuant is an AI trading platform where you describe a strategy in plain English and backtest it on real data, with no coding required. That makes it quick to test the same rules several ways.
- Test more assets: run the unchanged rules as separate backtests on other coins, for example ETHUSDT and SOLUSDT, and add up the trades.
- Use a longer window: Kaiko data via CoinQuant goes back to 2017 for BTC, so a longer test can add earlier cycles.
- Try a lower timeframe: CoinQuant supports 19 timeframes, from one minute to one month (which ones you can use depends on your plan), so the same idea on 4-hour bars will usually trade more often. Treat it as a new strategy and judge it on its own sample.
- Record every run: keep each result in your library, including the bad ones, so you can see the full picture.
Common mistakes
- Loosening the rules to get more trades: that tests a different strategy, not the original one.
- Trusting a big Profit Factor from a small sample: read Total Trades first.
- Testing many variants and keeping the best: the more versions you try, the more likely the winner is luck.
- Counting trades but not regimes: fifty trades in one bull market are still one regime.
The Practical Lesson
- Read the trade count before any other metric: three trades and a Profit Factor of 20.11 is a warning sign, not a result.
- Aim for at least 30 trades, ideally 100 or more: and check they spread across different market conditions. CoinQuant's results card needs 50+ trades to rate a run.
- Estimate first: trades per year times years tells you whether a test can ever reach a useful sample.
- Raise the sample honestly: more assets, longer windows and lower timeframes, with every run recorded.
Build trading strategies on real data. No coding required.
Frequently Asked Questions
How many trades do you need for a backtest to be statistically significant?
There is no single number, but a practical rule of thumb is at least 30 trades and ideally 100 or more. CoinQuant's results card sets its own bar at 50: below that, it marks a run "Statistically inconclusive". Strategies with large swings between wins and losses need more trades than steady ones before the averages settle.
Is 30 trades enough to trust a backtest?
Thirty is a minimum, not a guarantee. CoinQuant's own results card still labels any run under 50 trades "Statistically inconclusive". It helps if those trades cover rising, falling and sideways markets and the result holds on other assets and windows.
Why does my backtest with only a few trades show a huge Profit Factor?
Profit Factor divides gross profit by gross loss, so a single big winner and a single small loser can produce an extreme figure. AI EMA 50/200 1D Trend Strategy shows 20.11 from just three trades, which is too few to rely on.
Check the trade count on your own idea before you trust its results.
Disclaimer:
Key Takeaway