
Active Trading vs Buy and Hold in Crypto: What 5 Backtested Strategies Show (2021-2026)
Trading vs buy and hold crypto has no single answer. Across five backtested strategies from the CoinQuant Strategy Library, holding won on Bitcoin and trading won on Ethereum and Solana. Every strategy also fell less at its worst point than simply holding the same coin. So the honest answer depends on two things: the asset, and how deep a fall you can sit through without selling.
US spot Bitcoin ETFs drew $2.39B in net inflows from September 21 to 25, 2026, according to crypto.news, citing Farside data. The same report notes that flows do not establish how much of the price move came from ETF demand.
A strong week also says nothing about a full cycle. Five years of matched backtests say more.
How the Comparison Was Run
Every result uses the same setup, so within each asset the only difference is the decision to trade or to hold.
| Parameter | Setting |
|---|---|
| Strategy | BTC Relative Volatility Index Cross 1D 2021-2026; BTC Bias 20 Reversion 1D 2021-2026; ETH Efficiency Ratio Trend Filter 1D 2021-2026; ETH WMA 20/50 Cross 1D 2021-2026; SOL Linear Regression Cross 1D 2021-2026 (existing Strategy Library strategies, no re-tuning) |
| Benchmark | BTC Buy and Hold 1D 2021-2026; ETH Buy and Hold 1D 2021-2026; SOL Buy and Hold 1D 2021-2026 |
| Instruments | BTCUSDT, ETHUSDT, SOLUSDT (Binance spot) |
| Data | Kaiko via CoinQuant |
| Timeframe | Daily (1D) |
| Window | 2021-08-01 to 2026-08-01 |
| Initial capital | $10,000 |
| Position size | 100% of equity per entry |
| Fees | 0.1% taker on every fill, included in all results |
| Slippage | Not set |
| Direction | Long only, no leverage |
Each buy and hold benchmark buys on the first bar and holds to the end of the test, paying the same fee rate. Profit factor is not shown for the benchmarks, because a single buy and hold trade makes the ratio meaningless.
Five Results vs Buy and Hold
| Strategy | Asset | Trades | Strategy return | Buy and hold return | Higher return |
|---|---|---|---|---|---|
| BTC Relative Volatility Index Cross 1D 2021-2026 | BTC | 203 | -40.09% | +57.33% | Buy and hold |
| BTC Bias 20 Reversion 1D 2021-2026 | BTC | 17 | +30.73% | +57.33% | Buy and hold |
| ETH Efficiency Ratio Trend Filter 1D 2021-2026 | ETH | 4 | +7.37% | -27.95% | Strategy |
| ETH WMA 20/50 Cross 1D 2021-2026 | ETH | 24 | +58.53% | -27.95% | Strategy |
| SOL Linear Regression Cross 1D 2021-2026 | SOL | 61 | +138.64% | +110.02% | Strategy |
Does trading beat buy and hold? On raw return, three times out of five. Both Bitcoin strategies trailed holding, and all three Ethereum and Solana strategies finished ahead.
The lead case shows the trade-off most clearly. BTC Bias 20 Reversion 1D 2021-2026 buys when Bitcoin's close falls more than 10% below its 20-day simple moving average and exits when price returns to that average. It turned $10,000 into $13,073.45 from 17 trades. Holding Bitcoin turned the same $10,000 into $15,733.43.
| Metric | Strategy | Buy and Hold |
|---|---|---|
| Strategy | BTC Bias 20 Reversion 1D 2021-2026 | BTC Buy and Hold 1D 2021-2026 |
| Total Return | +30.73% | +57.33% |
| Final balance | $13,073.45 | $15,733.43 |
| Total Trades | 17 | 1 |
| Win Rate | 58.82% | n/a (single hold) |
| Profit Factor | 1.41 | n/a |
| Sharpe Ratio | 0.33 | 0.44 |
| Max Drawdown | 38.13% | 76.63% |
| Time in market | 16.15% | 100.00% |
| Total fees | $423.24 | $25.74 |
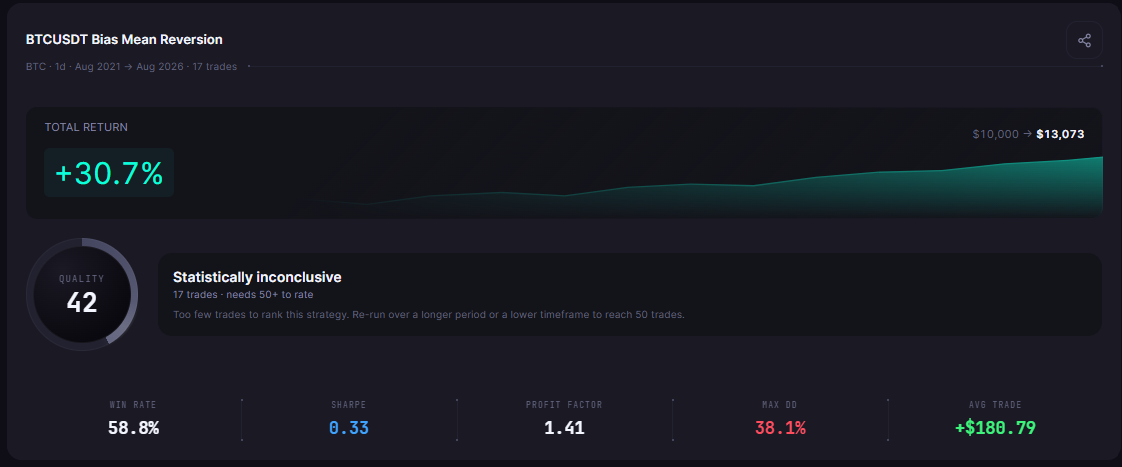
BTC Bias 20 Reversion 1D 2021-2026 returned +30.73% from 17 trades, with a 38.13% max drawdown (CoinQuant backtest, 2021 to 2026).
Screenshot from the author's CoinQuant account. Backtest results are hypothetical, based on historical data with modelled fees, and do not guarantee future performance. Not financial advice.
Trading vs Buy and Hold Crypto: Where Each One Won
The split follows the assets, and one mechanism explains most of it: time out of the market cuts both ways.
Bitcoin: holding won both tests. Holding Bitcoin returned 57.33% over the window. The Bias strategy was in the market only 16.15% of the time and missed much of that rise, while the RVI cross traded 203 times and lost 40.09%.
Ethereum: trading won both tests. Holding Ether lost 27.95% over the same five years. Both strategies spent long stretches in cash and finished with gains. The Efficiency Ratio filter's +7.37% came from only four trades, so treat it as thin evidence.
Solana: trading won on return, not on risk-adjusted return. The Linear Regression cross returned +138.64% against +110.02% for holding, but its Sharpe ratio was 0.58 against 0.64 for simply holding SOL.
In hodl vs trading debates, the missing variable is usually the path. Holding captured the full move on BTC and SOL, but it also rode every crash to the bottom, which the drawdown table below makes concrete.
None of this says active trading is better or worse in general. It says a rule that steps aside does best when the asset is falling or going nowhere, and pays for it when the asset climbs.
Drawdown: The Number That Changes the Answer
Return is only half of the comparison. Here is the other half, for every row:
| Strategy | Strategy max drawdown | Buy and hold max drawdown | Strategy Sharpe | Buy and hold Sharpe |
|---|---|---|---|---|
| BTC Relative Volatility Index Cross 1D 2021-2026 | 60.37% | 76.63% | -0.14 | 0.44 |
| BTC Bias 20 Reversion 1D 2021-2026 | 38.13% | 76.63% | 0.33 | 0.44 |
| ETH Efficiency Ratio Trend Filter 1D 2021-2026 | 29.50% | 79.30% | 0.17 | 0.26 |
| ETH WMA 20/50 Cross 1D 2021-2026 | 54.15% | 79.30% | 0.43 | 0.26 |
| SOL Linear Regression Cross 1D 2021-2026 | 69.12% | 96.27% | 0.58 | 0.64 |
All five strategies had a shallower maximum drawdown than holding the same coin. On Bitcoin, the lead case fell 38.13% at its worst while holding fell 76.63%, roughly half the depth.
Depth matters because recovery is not symmetrical. After a 76.63% fall, the remaining capital has to more than quadruple to get back to its peak. After a 38.13% fall, it needs to grow by less than two thirds.
That is why a higher benchmark return is not automatically your return. A buy and hold result you would have sold in a panic near the bottom was never really available to you.
How to Run Your Own Benchmark Test
CoinQuant backtest charts include a Buy & Hold benchmark line (added in the April 27, 2026 update), so the buy and hold benchmark sits in the same view as your strategy. A fair test takes five steps:
Pick one asset and one long window. Include at least one bear market and one rally.
Describe the strategy in plain English. No coding required.
Keep fees and sizing identical to the benchmark: same fee rate, same capital, same position size.
Read return, max drawdown and Sharpe side by side against the Buy & Hold line, not return alone.
Write down the drawdown you can tolerate before you look. Then check which result you could actually have held.
For example, the lead case can be typed into CoinQuant like this:
Buy BTCUSDT on the daily chart when the close is 10% below its 20-day simple moving average. Sell when the close returns to the 20-day average. Test from August 1, 2021 to August 1, 2026 with $10,000, 100% of equity per trade and a 0.1% fee.
For more single-strategy benchmark tests, see the Klinger Volume Oscillator backtest against buy and hold, whether buying the dip works in crypto and strategies tested through a bear market. Does backtesting actually work? covers the method itself.
The Practical Lesson
Holding won on Bitcoin in both tests, because both strategies missed too much of holding's 57.33% return.
Trading won on Ethereum and Solana, most clearly where the asset fell: holding ETH lost 27.95% while both ETH strategies finished with gains.
Every strategy cut the worst drawdown, from 76.63% to 38.13% in the lead case.
Risk-adjusted, the gap is narrower than returns suggest. Only one of five strategies beat its benchmark's Sharpe ratio.
The useful question is not whether trading beats holding. It is which result you could have lived with, on the asset you actually trade. Build trading strategies on real data. No coding required.
Benchmark your own strategy against simply holding. See why traders choose CoinQuant
Disclaimer:
This content is for educational and informational purposes only and does not constitute financial, investment, or trading advice. All strategies and examples are for illustrative purposes and do not guarantee results. Always conduct your own research before making financial decisions.
