
CCI Trading Strategy Backtest on Bitcoin: Range Oscillator in a Low-Volatility Market
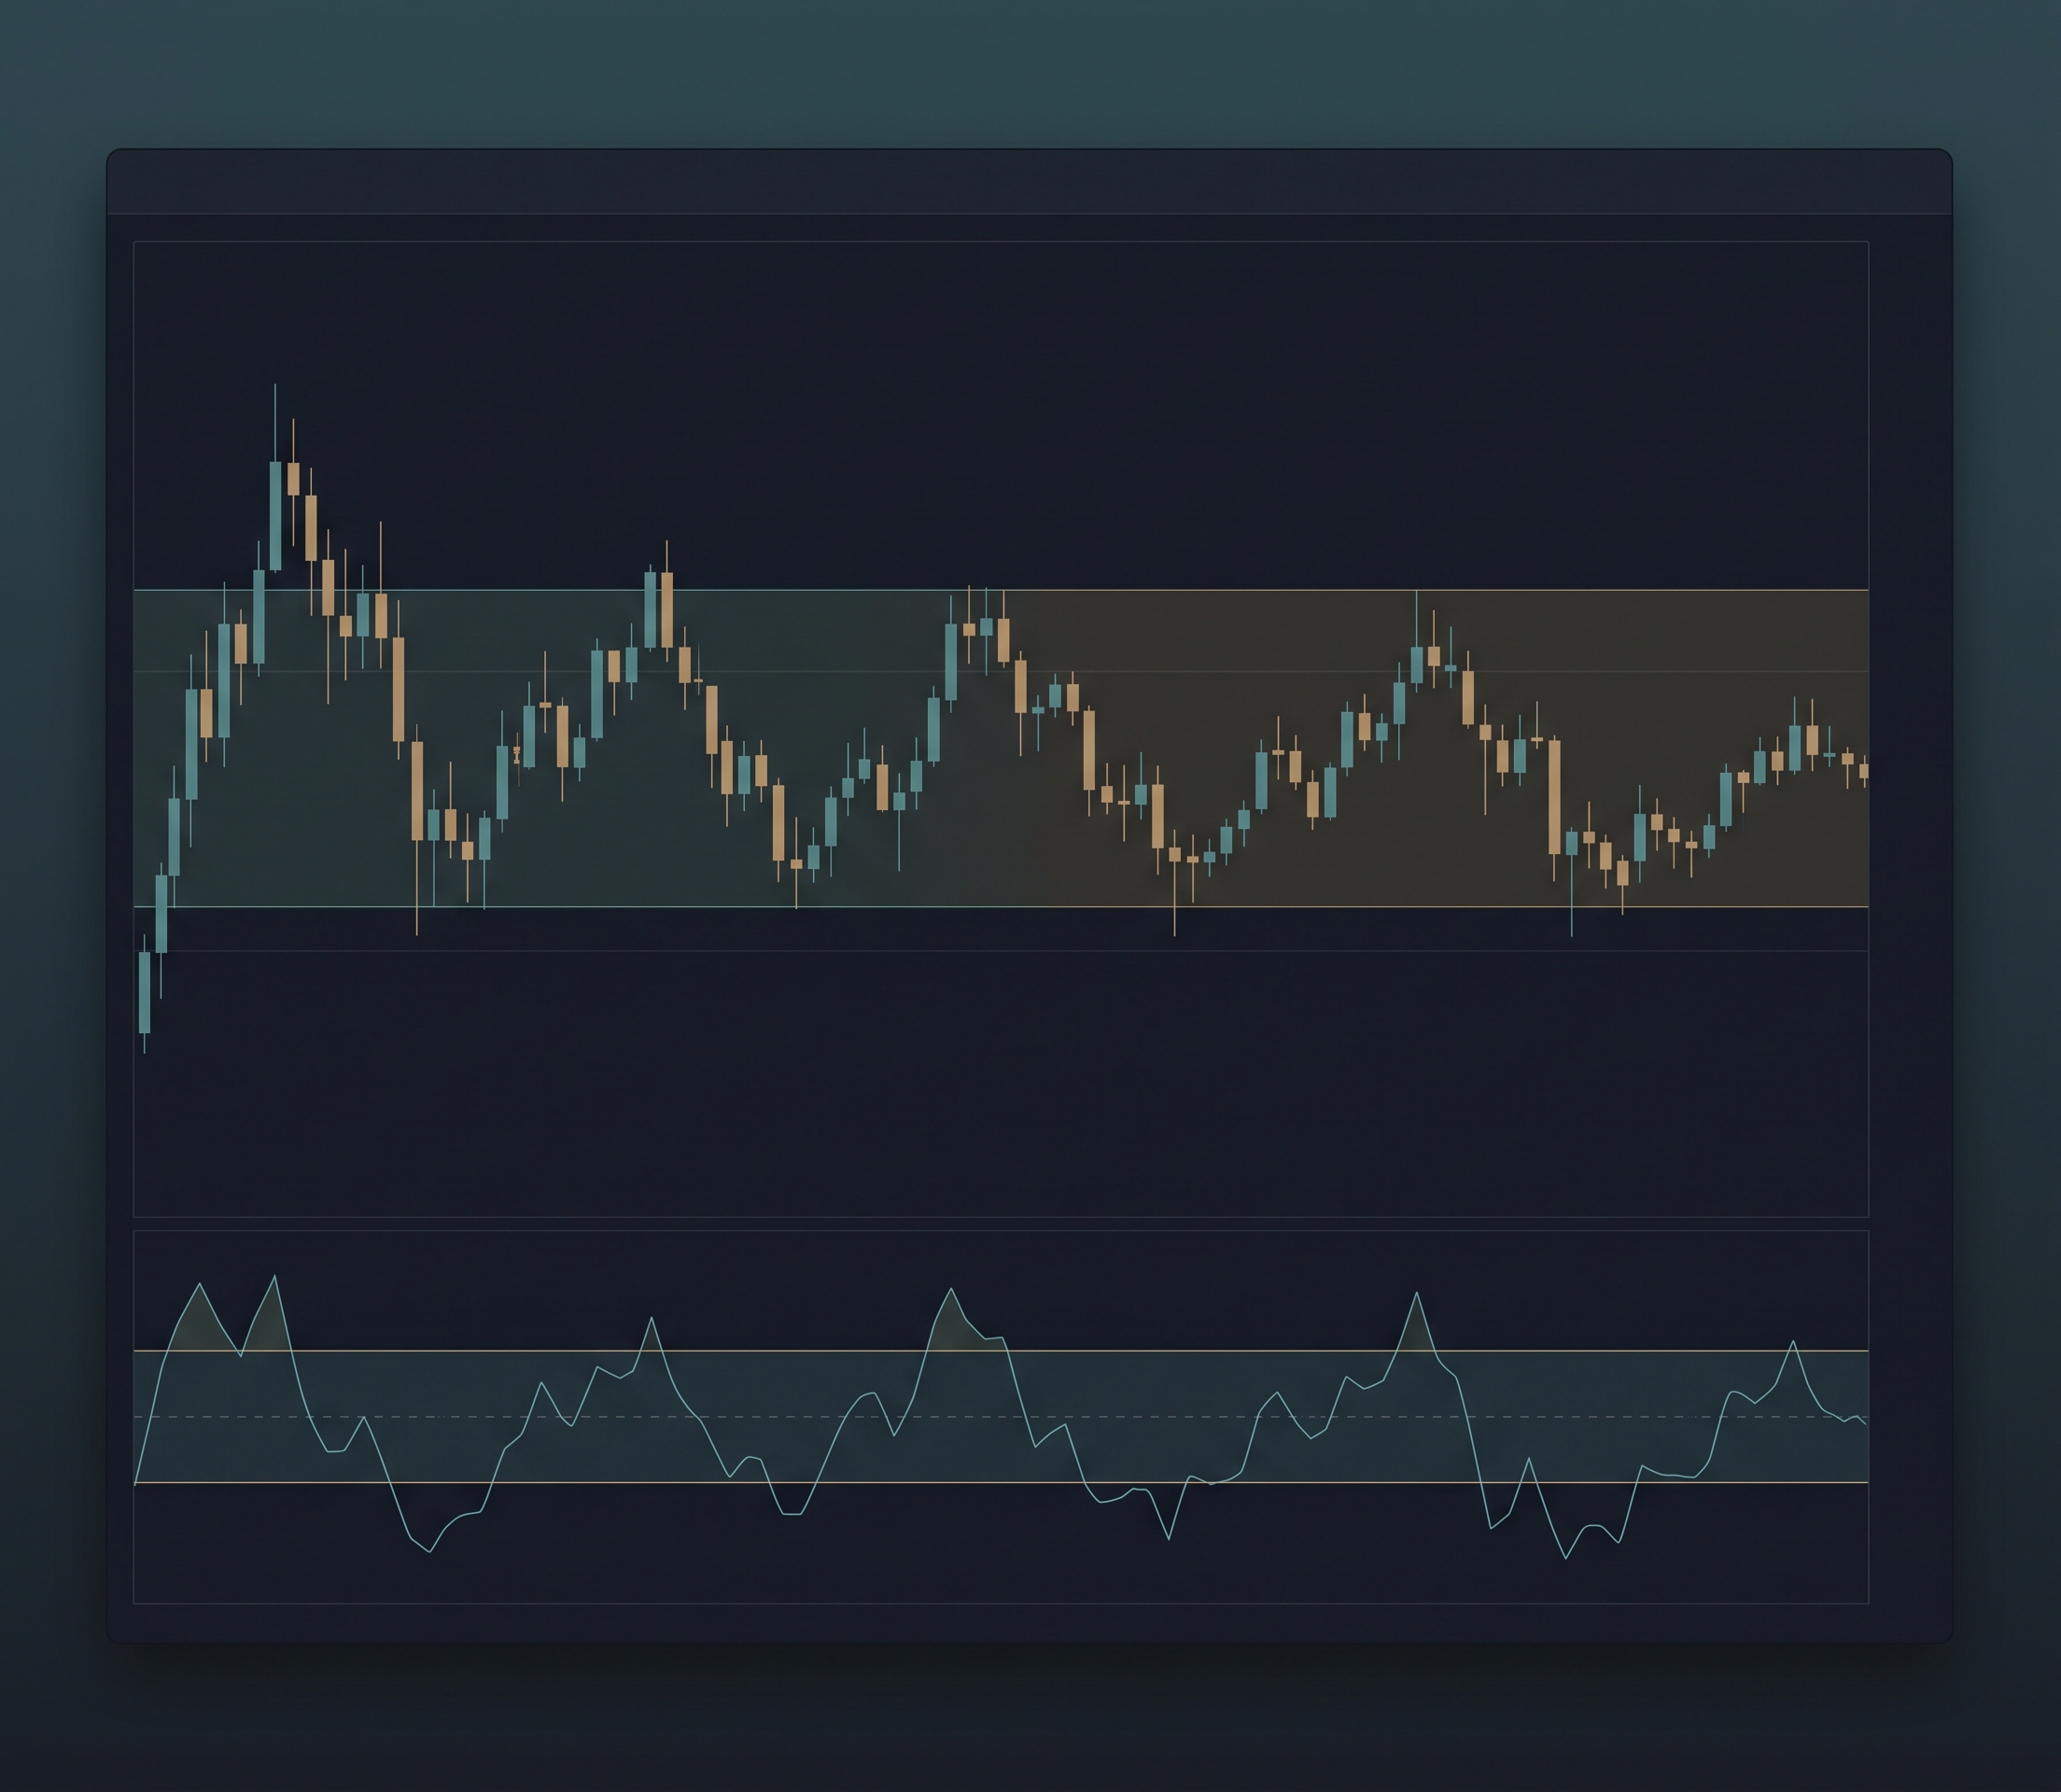
The Commodity Channel Index is a range oscillator, which makes sideways markets its natural habitat. Bitcoin spent much of mid-2026 locked in a narrow band near $64,000 to $65,000, with 30-day implied volatility sitting near 36%, close to the floor of its multi-year range. In conditions like these, traders reach for oscillators because they promise to time the swings that trend-following systems miss.
This article tests that promise with one CCI trading strategy from the CoinQuant strategy library: BTC CCI(20) Range Oscillator 4H (Clone), backtested on four-hour Bitcoin data over the 12 months to August 1, 2026. Fees are included in every result. No cherry-picked window, no adjusted numbers.
What the CCI Trading Strategy Does
CCI measures how far price has strayed from its average, scaled by how much price normally varies. Readings above +100 mark unusually strong upward deviations, and readings below -100 mark unusually strong downward ones. The oscillator is unbounded, which is why the +100 and -100 levels matter: they flag deviations strong enough to trade.
The strategy tested here applies the two classic range rules on the default 20-period setting, using the typical price (high, low, close average) as input:
Entry: long when CCI(20) crosses above +100
Exit: long when CCI(20) crosses back below 0
The logic is simple: enter when Bitcoin shows a genuine bullish deviation, and exit when momentum returns to neutral. The strategy is long-only, uses 100% of equity per entry, holds a maximum of one position, and layers no filters on top of the CCI signal.
Test Setup
| Parameter | Setting |
|---|---|
| Instrument | BTCUSDT (Binance spot) |
| Timeframe | Four-hour (4H) |
| Period | Aug 1, 2025 to Aug 1, 2026 |
| CCI settings | 20-period, entry +100, exit 0 |
| Direction | Long only, no leverage |
| Initial capital | $10,000 |
| Position size | 100% of equity, one position max |
| Fees and slippage | Included (Binance standard fees) |
| Data source | Kaiko via CoinQuant |
The Backtest Results
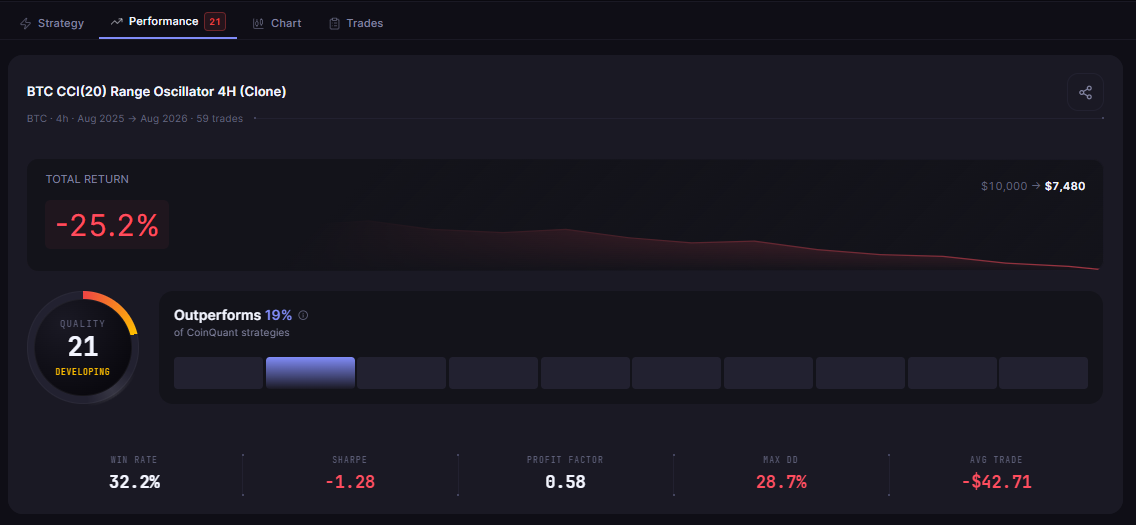
Over the 12 months, the strategy turned $10,000 into $7,480. The total return was -25.20% across 59 trades, with the account holding a position only 38.16% of the time.
| Metric | Result |
|---|---|
| Total Return | -25.20% ($10,000 to $7,480) |
| Annualized Return (CAGR) | -25.20% |
| Total Trades | 59 |
| Win Rate | 32.2% (19 wins / 40 losses) |
| Profit Factor | 0.58 |
| Sharpe Ratio | -1.28 |
| Sortino Ratio | -1.80 |
| Calmar Ratio | -0.88 |
| Max Drawdown | 28.75% |
| Average Win | $181.26 |
| Average Loss | $149.10 |
| Best Trade | +$941.16 |
| Worst Trade | -$459.34 |
| Time in Market | 38.16% |
| Total Fees | $201.90 |
What the Data Shows
The headline number is the profit factor of 0.58. For every $1.00 the strategy lost, it produced only $0.58 in gross profit. That is negative expectancy, and it was consistent: 40 of the 59 trades closed as losers.
The win rate of 32.2% is not the problem by itself. The problem is the payoff. The average win of $181.26 is only 1.22 times the average loss of $149.10, so the strategy could not overcome its low hit rate. A range oscillator that catches every swing needs either a much higher win rate or much larger wins to be worth trading.
Fees make the picture worse. $201.90 in trading costs on a $10,000 account is roughly 2% of drag on top of the signal losses. In a choppy, low-volatility market, 59 round trips add up quickly, and every one of those trips must pay its own way.
The Drawdown Is the Hidden Cost
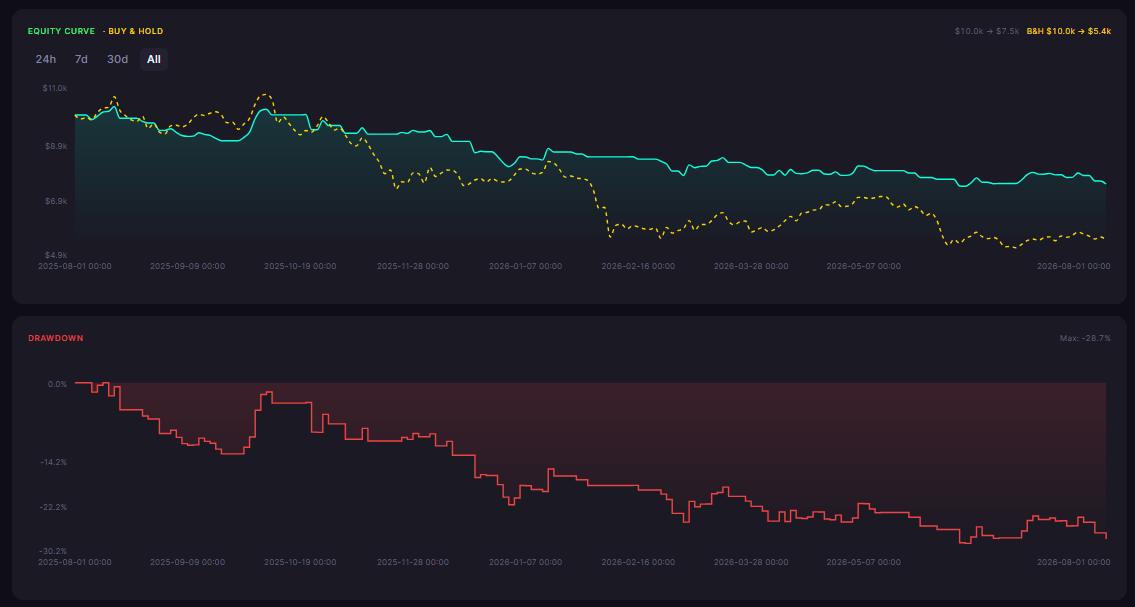
The most uncomfortable number is the 28.75% max drawdown. A strategy that spends only 38% of its time in the market still gave back nearly 29% of the account from peak to trough at its worst point.
The risk-adjusted ratios reflect this tension:
Sharpe -1.28 is deeply negative for a 12-month window
Sortino -1.80 shows the downside volatility was severe
Calmar -0.88 confirms the return was poor relative to the drawdown
The strategy lost money, and it lost money while taking meaningful risk. That combination is the clearest possible signal that the edge was not there in this market.
CCI in a Low-Volatility Market: The Signal Frequency Trap
The classic criticism of range oscillators is that they generate too many signals in a range, and most of those signals are false. This backtest quantifies that criticism: 59 entries in 12 months means roughly five signals per month, and only a third of them closed in profit.
When volatility is low, CCI spends more time between +100 and -100, and crossings of +100 often come from minor deviations that reverse within days. The strategy was not failing because CCI is broken. It was failing because the signal fired into a market that did not follow through.
The Practical Lesson
This backtest is not a verdict on CCI itself. It is a measurement of what one unmodified range oscillator configuration did on Bitcoin during a low-volatility year:
Negative expectancy: profit factor 0.58, total return -25.20%
Signal frequency was the problem: 59 trades, 32.2% win rate, and a payoff ratio near 1.2
Drawdown was disproportionate: 28.75% max drawdown for a strategy in the market 38% of the time
The next step is not to abandon CCI but to test variations: a higher-timeframe trend filter, an entry threshold above +100, a wider exit, or fewer signals per month. Each variation needs its own backtest before it earns a place in a live strategy. That is the entire point of running a CCI backtest on Bitcoin first: you see the drawdown on a spreadsheet, not in your account.
Disclaimer:
Key Takeaway
