
Ethereum Trading Strategy: 5 Approaches Backtested (2026)

Ethereum is back in focus in August 2026. ETH ETFs have led altcoin flows with sustained inflows during 2026, and analysts are framing ETH as quietly setting up its biggest move of the year. Attention is flowing toward ETH, and with attention comes the question this article answers: what trading strategy actually works on Ethereum? The ETF inflow channel matters beyond the headlines: institutional flows into ETH change the asset's expansion profile, and the strategy that fits a range-bound ETH is not the strategy that fits an ETH absorbing record inflows.
Five approaches, trend following, mean reversion, breakout, moving average cross, and momentum, were backtested on ETHUSDT daily candles from January 2021 to August 2026. Every run used the same assumptions: Binance spot, $10,000 initial capital, 100% position size, one position at a time, long only, no leverage, and Binance standard taker fees (0.1%) included in every result. All five strategies are named entries in the CoinQuant Strategy Library, so each one can be opened and re-run.
The Five Approaches, Defined
| Strategy (library name) | Family | Entry rule | Exit rule |
|---|---|---|---|
| ETH Breakout 1D 2021-2026 | Breakout | Close above highest high of prior 20 bars | Close below lowest low of prior 20 bars |
| ETH EMA Crossover 20/50 1D 2021-2026 | Trend (MA cross) | EMA(20) crosses above EMA(50) | EMA(20) crosses below EMA(50) |
| ETH MACD Trend 1D 2021-2026 | Momentum | MACD(12,26,9) crosses above signal | MACD crosses below signal |
| ETH Bollinger Mean Reversion 1D 2021-2026 | Mean reversion | Close crosses below lower Bollinger band (20, 2.0) | Close crosses above middle band |
| ETH RSI Mean Reversion 1D 2021-2026 | Mean reversion | RSI(14) crosses below 30 | RSI(14) crosses above 50 |
Ethereum Trading Strategy Results: Ranked
| Rank | Strategy | Total Return | Trades | Win Rate | Profit Factor | Sharpe | Max DD |
|---|---|---|---|---|---|---|---|
| 1 | ETH Breakout 1D 2021-2026 | +231.7% | 21 | 47.6% | 1.40 | 0.67 | 64.5% |
| 2 | ETH EMA Crossover 20/50 1D 2021-2026 | +39.0% | 18 | 33.3% | 1.29 | 0.36 | 62.4% |
| 3 | ETH MACD Trend 1D 2021-2026 | +30.5% | 76 | 32.9% | 1.06 | 0.34 | 58.9% |
| 4 | ETH Bollinger Mean Reversion 1D 2021-2026 | +9.3% | 36 | 69.4% | 1.03 | 0.26 | 59.2% |
| 5 | ETH RSI Mean Reversion 1D 2021-2026 | -57.2% | 10 | 30.0% | 0.25 | -0.26 | 63.8% |
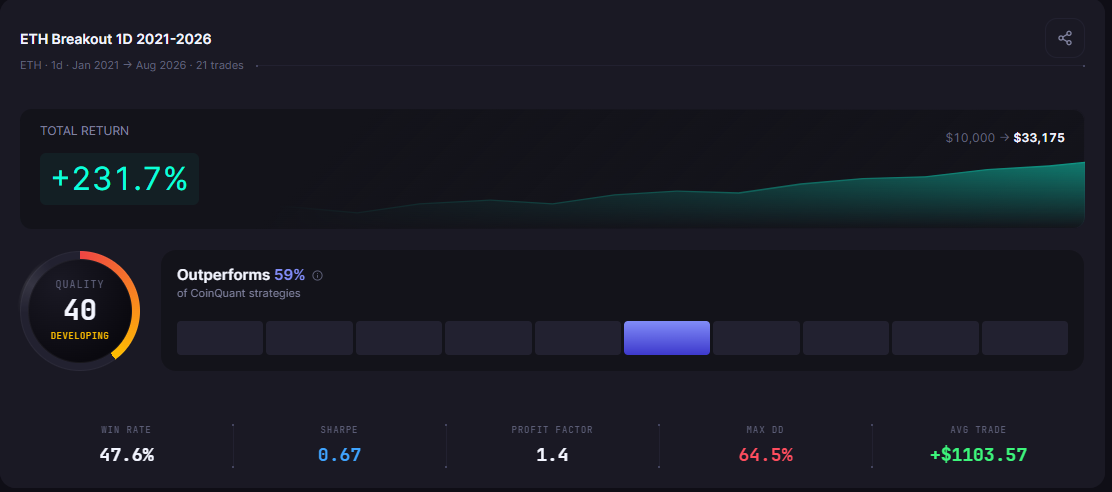
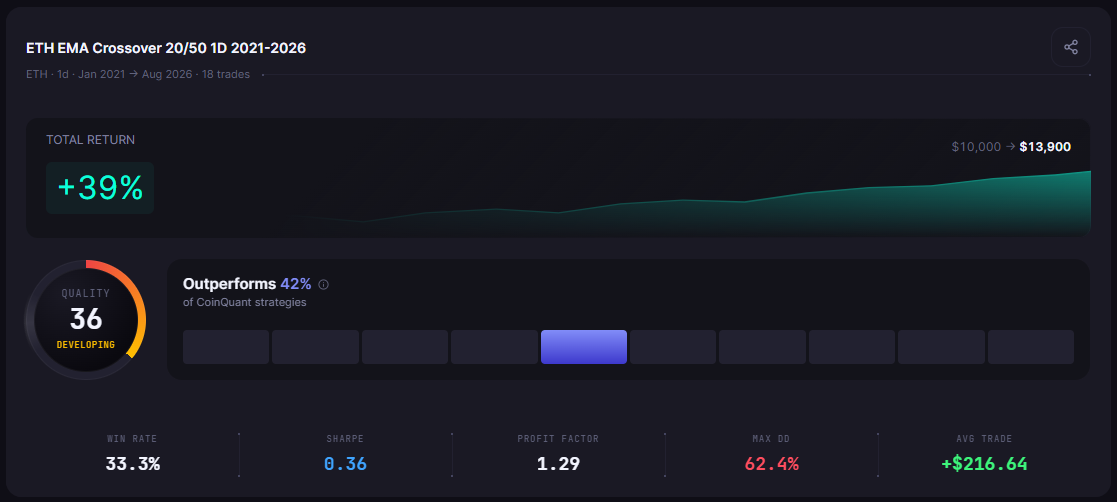
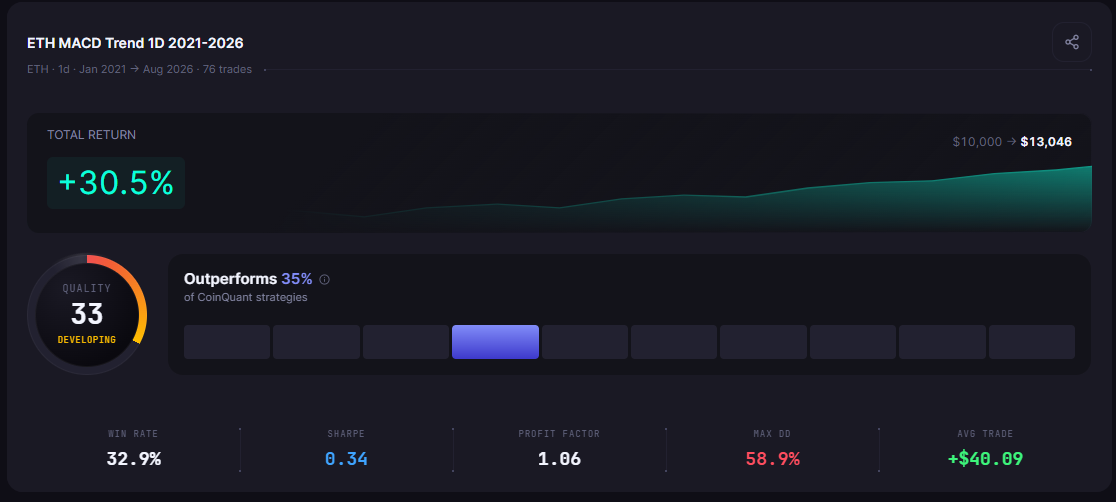
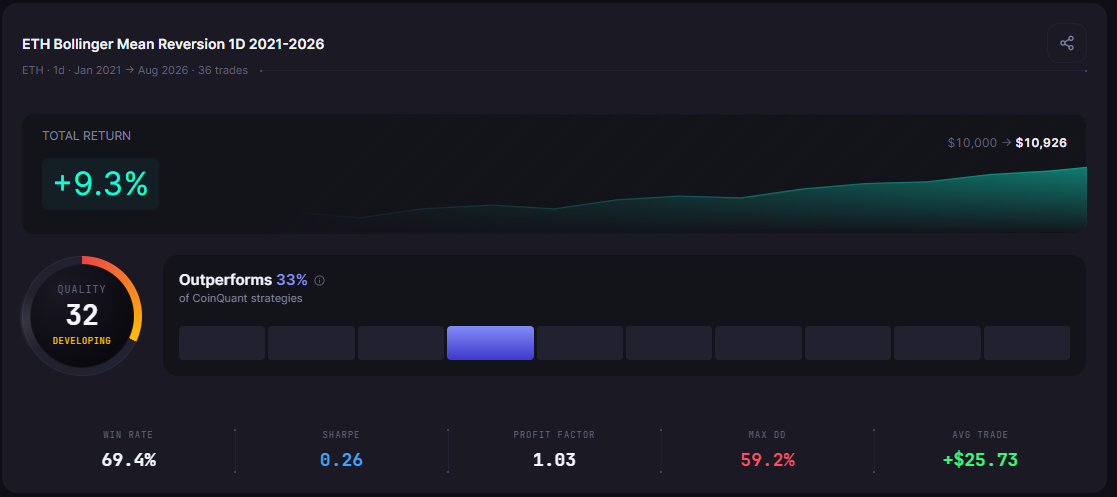
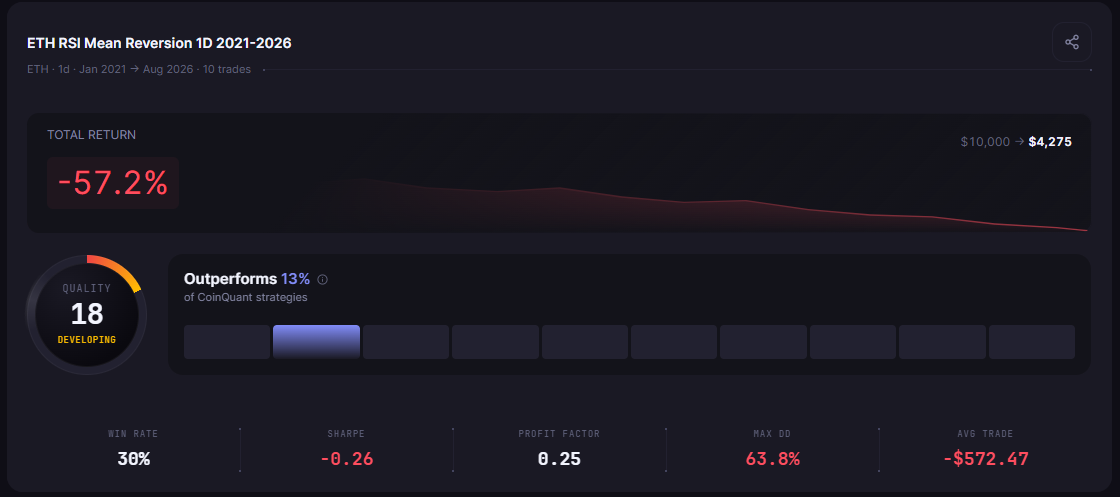
The spread is the story: the best Ethereum strategy returned +231.7% and the worst lost 57.2% on the same asset, same window, same fees. On Ethereum, strategy choice is not a detail, it is the whole game.
Winner: Breakout on Ethereum
ETH Breakout 1D 2021-2026 is the standout by every measure: +231.7% total return ($10,000 to $33,175), the best Sharpe at 0.67, a 47.6% win rate, and a profit factor of 1.40.
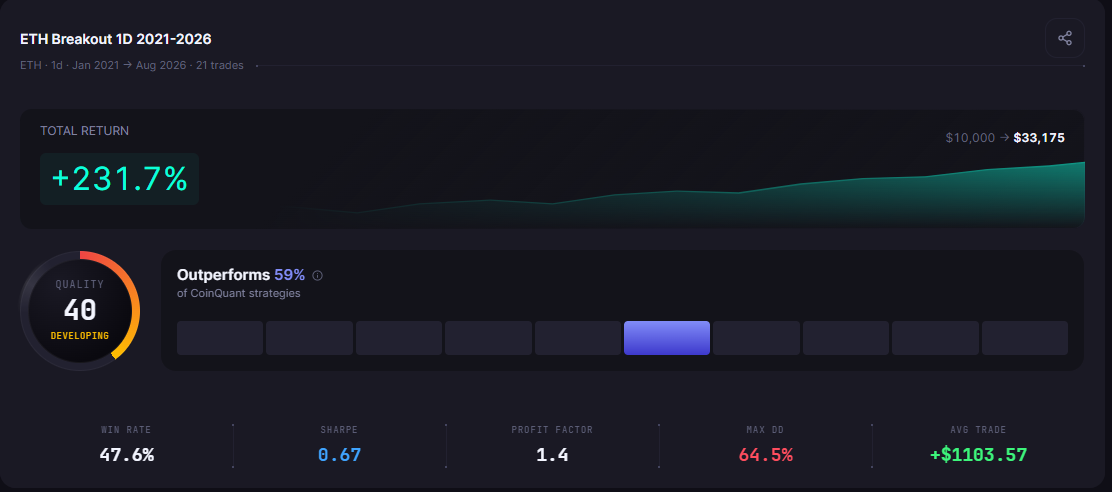
Ethereum rewards breakouts more than Bitcoin does. ETH's history is full of violent expansions, the 2021 run from its early-year lows to cycle highs, the 2023-2024 recovery, and the sharp ETF-driven moves of 2025-2026, and a 20-bar breakout rule catches those expansions early and rides them. The strategy traded only 21 times in five and a half years, which means it spent most of the window in cash and acted exactly when ETH's range expanded.
The cost is the 64.5% max drawdown. ETH moves harder than BTC in both directions, and a breakout strategy eats the full round trip when a breakout fails. The 2022 bear market produced a sequence of false upside breakouts that the strategy paid for in full.
Trend and Momentum: Solid but Quiet
The two trend-family strategies finished positive but far behind breakout.
ETH EMA Crossover 20/50 returned +39.0% with a profit factor of 1.29 across 18 trades. It is the middle-of-the-road Ethereum strategy: it participates in trends without the violent swings of breakout, and its 62.4% drawdown shows it still rode the 2022 decline most of the way down.
ETH MACD Trend returned +30.5% but needed 76 trades to do it, and its profit factor of 1.06 sits close to breakeven. The MACD cross on daily ETH whipsaws in ranges, and the fees, $2,084.93 over the window, are the highest of the five. It is the most fragile edge in the trend group: positive, but with little margin for error.
Mean Reversion: The Divergence That Matters
The two mean-reversion approaches split hard.
ETH Bollinger Mean Reversion won 69.4% of its trades, the highest win rate in the test, and still only returned +9.3%. The profit factor of 1.03 explains it: frequent small wins, occasional large losses, and a 59.2% drawdown that erased most of the compounding. This is the same pattern the Bollinger reversion showed on Bitcoin, and on ETH it is even more extreme.
ETH RSI Mean Reversion lost 57.2%, the worst result in the test. Buying ETH when RSI(14) crosses below 30 is a strategy for catching falling knives, and on daily ETH between 2021 and 2026 the knives kept falling: the 2022 bear market produced repeated oversold readings that kept losing. The strategy's profit factor of 0.25 means it returned only $0.25 for every $1.00 it lost.
The lesson is the same one the mean reversion vs trend following comparison documents in detail: reversion needs a trend filter or a range-bound regime to work, and on a trending asset like ETH it fails without one.
Why Ethereum Differs From Bitcoin
The same five families were backtested on Bitcoin in the Bitcoin five-approach study, and the rankings are not identical. On BTC, breakout also won, but the gap was narrow and every strategy finished positive. On ETH, breakout won by a factor of six over the second-place strategy, and the RSI reversion strategy lost more than half its capital.
The reason is ETH's volatility profile. ETH has a higher beta than BTC: larger rallies, deeper drawdowns, and sharper range expansions. Assets with that profile reward breakout rules that wait for expansion and punish mean-reversion rules that buy weakness, because on ETH weakness tends to continue. The same logic explains why the ETF-flow catalyst in August 2026 is strategically important: inflow-driven range expansion is exactly the regime the winning strategy on this list is built to capture.
The trade-by-trade evidence in the breakout run shows the mechanism. Its 21 trades produced a best day of +$14,275 and a worst day of -$13,083, and the strategy's profit factor of 1.40 came from riding the 2021 and 2023-2024 expansion legs in full while cutting the 2022 failures quickly. The MACD run, by contrast, paid $2,084.93 in fees over 76 trades, one and a half times the breakout strategy's total fee bill of $1,347.63, for less than a seventh of the return. On Ethereum, the fee math punishes frequent trading harder than on Bitcoin, because ETH's intraday chop generates more false signals per unit of trend.
The Practical Takeaway for Trading Ethereum
Best return: breakout, +231.7%, with the deepest drawdown to match
Best risk-adjusted profile: breakout again, Sharpe 0.67
Safest edge: EMA crossover, +39.0% with a 1.29 profit factor
Avoid on ETH: daily RSI mean reversion without a regime filter
Ethereum in 2026 is a breakout asset. The strategy that fits it is patient, selective, and comfortable with drawdown, and the strategy that does not fit it is the one that buys every dip. The numbers above are reproducible on CoinQuant, and the next step before risking capital is to reproduce them and test variations: a 55-bar breakout window, a volume filter, or a higher-timeframe trend filter on the weekly chart.
Disclaimer:
Key Takeaway
