
Bitcoin Since Its October 2025 High: Did a Trend Rule Lose Less Than Holding?

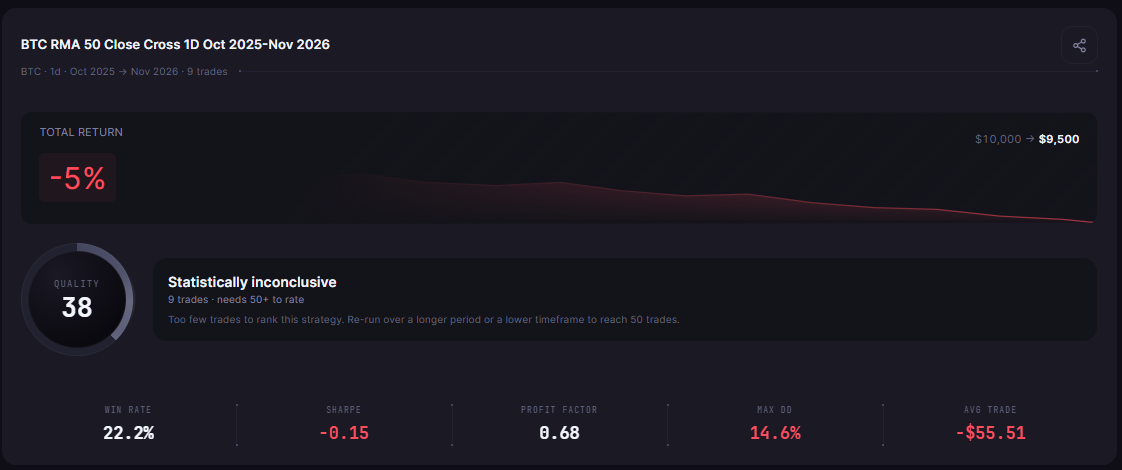
The Bitcoin drawdown from ATH reached 37.15% by the close of 1 November 2026: that close was 37.15% below the highest daily close, set on 6 October 2025 (Binance BTCUSDT daily candles, UTC). We tested one simple trend rule on CoinQuant from that exact day. It lost 5.00% over nine trades, while buying and holding Bitcoin over the same window lost 37.27%, fees included.
So the rule lost far less, but it still lost money. With only nine trades, the results card marks it "Statistically inconclusive", so treat this as a description of one fall, not proof of an edge.
The author ran both backtests on CoinQuant, an AI trading platform, with the same start date, capital and fee. This article reports the results without adjustment: no tuned parameters, no cherry picked dates.
Bitcoin Drawdown From ATH: How Far It Fell From Its High
The fall below is measured from one daily close to another. All prices come from closed Binance BTCUSDT daily candles in UTC, checked on 3 November 2026.
| Reference | Date (UTC candle) | Price (USDT) | 1 November 2026 close below it |
|---|---|---|---|
| Highest daily close | 6 October 2025 | 124,658.54 | 37.15% |
| Close of the window end | 1 November 2026 | 78,354.00 | n/a |
The method is simple: take the highest daily close, 124,658.54 on 6 October 2025, and compare the 1 November 2026 close of 78,354.00 with it. Measured that way, the BTC percentage drawdown from ATH was 37.15%.
On time, the count is fixed to the test: there are 391 days from 6 October 2025 to 1 November 2026. If you are searching for Bitcoin days since all time high on a later date, add the days that have passed since 1 November 2026.
The Rule and the Settings
The rule uses a smoothed moving average, often called RMA. CoinQuant's Supported Elements page describes it as "also called the Rolling Moving Average or Wilder's Smoothing". In plain words, on each new candle the RMA 50 keeps 49 parts of its previous value and adds one part of the new close, so it moves only 1/50 of the way toward each new price.
That slow, steady line makes this a classic smoothed moving average strategy:
- Entry: Close crosses above RMA (50) on the daily chart: enter long.
- Exit: Close crosses below RMA (50) on the daily chart: exit long.
| Parameter | Setting |
|---|---|
| Strategy | BTC RMA 50 Close Cross 1D Oct 2025-Nov 2026 |
| Instrument | BTCUSDT (spot, Binance) |
| Data source | Kaiko via CoinQuant |
| Timeframe | Daily (1D) |
| Tested window | 2025-10-06 to 2026-11-01 (effective data end 2026-11-01, as the backtest reports) |
| Entry | Close crosses above RMA (50, close) |
| Exit | Close crosses below RMA (50, close) |
| Direction | Long only, one position at a time, no leverage |
| Initial capital | $10,000 |
| Position size | 100% of equity per entry |
| Fees | 0.1% taker, on every entry and exit (no slippage modelled) |
| Baseline (same window) | BTC Buy and Hold 1D Oct 2025-Nov 2026 |
The engine warms the RMA 50 up on candles from before the window, so the average already exists on 6 October 2025. For more on this, see why a long indicator lookback need not delay your first trade. The same indicator on its own longer record sits on the BTC RMA strategy page.
Result and Buy and Hold Comparison
Both runs start with $10,000 on 6 October 2025 and end on the 1 November 2026 candle. Holding Bitcoin is the BTC Spot Comparison here, because the rule trades Bitcoin itself.
| Metric | RMA 50 rule | BTC Spot Comparison (same window) |
|---|---|---|
| Strategy | BTC RMA 50 Close Cross 1D Oct 2025-Nov 2026 | BTC Buy and Hold 1D Oct 2025-Nov 2026 |
| Total Return | -5.00% | -37.27% |
| Final Balance | $9,500.37 | $6,273.06 |
| Total Trades | 9 | 1 |
| Win Rate | 22.22% (2 wins, 7 losses) | n/a (single hold) |
| Profit Factor | 0.68 | n/a (single hold) |
| Sharpe Ratio | -0.15 | -0.77 |
| Max Drawdown | 14.59% | 53.02% |
| Time in Market | 28.83% | 99.74% |
| Total Fees | $165.54 | $16.27 |
Both runs share the same window, capital, sizing and 0.1% fee, so the rows compare like with like. The rule lost 5.00% against 37.27% for holding, and its worst fall from a peak in equity was 14.59% against 53.02%.
Holding lost 37.27%, a little more than the 37.15% price move from close to close, mainly because the backtest pays the 0.1% fee on entry and on exit; its entry fill on the first candle, 124,656.00, sat close to that day's close. The rule paid more in fees, $165.54, because it traded nine times, yet it sat in cash for most of the fall.
On the Performance tab, the results card shows QUALITY 38 next to "Statistically inconclusive" (9 trades · needs 50+ to rate).
Every Trade the Rule Took
The starting condition is not the same for both runs, so it is worth stating. Holding put all $10,000 into Bitcoin on 6 October 2025. The rule started in cash and waited for its first signal, which came on 12 October 2025, six days later.
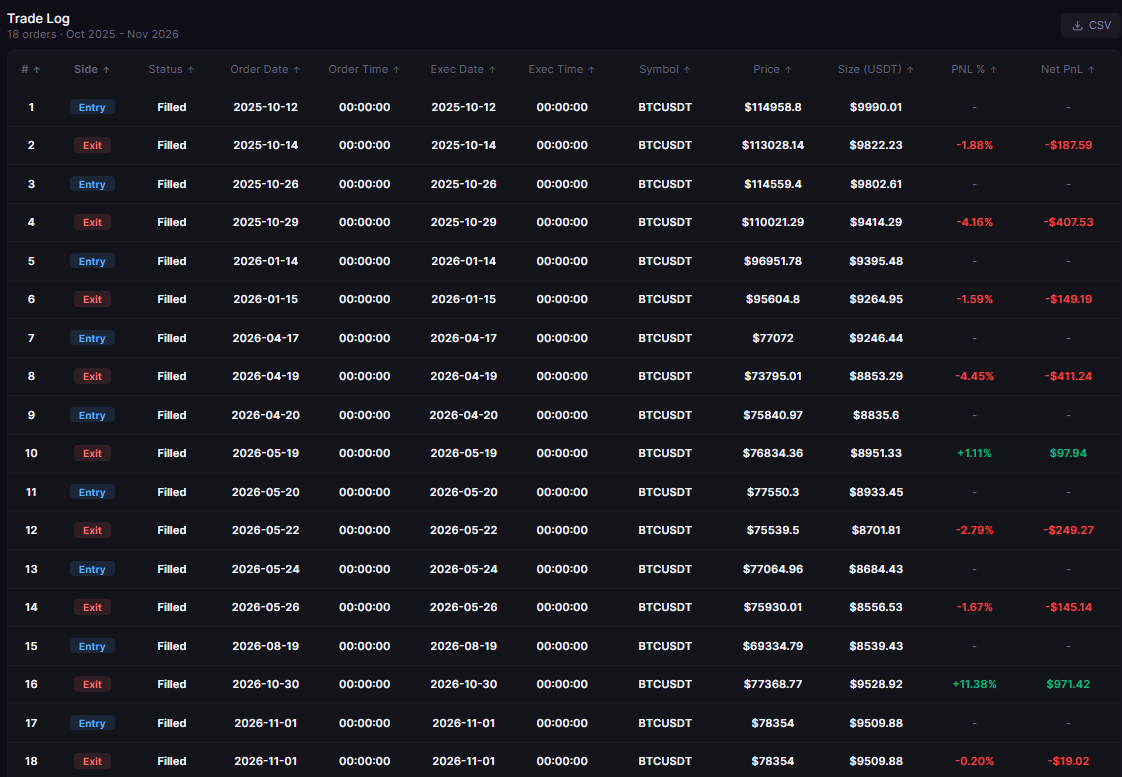
Here is every trade, with the engine's fill prices from the Trades tab and the net result after fees.
| Trade | Entry (UTC) | Exit (UTC) | Entry price | Exit price | Net PnL after fees |
|---|---|---|---|---|---|
| 1 | 2025-10-12 | 2025-10-14 | 114,958.80 | 113,028.14 | -$187.59 |
| 2 | 2025-10-26 | 2025-10-29 | 114,559.40 | 110,021.29 | -$407.53 |
| 3 | 2026-01-14 | 2026-01-15 | 96,951.78 | 95,604.80 | -$149.19 |
| 4 | 2026-04-17 | 2026-04-19 | 77,072.00 | 73,795.01 | -$411.24 |
| 5 | 2026-04-20 | 2026-05-19 | 75,840.97 | 76,834.36 | $97.94 |
| 6 | 2026-05-20 | 2026-05-22 | 77,550.30 | 75,539.50 | -$249.27 |
| 7 | 2026-05-24 | 2026-05-26 | 77,064.96 | 75,930.01 | -$145.14 |
| 8 | 2026-08-19 | 2026-10-30 | 69,334.79 | 77,368.77 | $971.42 |
| 9 | 2026-11-01 | 2026-11-01 | 78,354.00 | 78,354.00 | -$19.02 |
Three things stand out:
- Short losers: every losing trade lasted three days or less. In six of the seven, the close fell back below the average within days and the rule stepped aside; the seventh is the last trade, below.
- One real winner: the trade from 19 August to 30 October 2026 made $971.42, the best trade of the run. It did most of the work.
- A trade at the end: the last entry came on the 1 November 2026 candle, the final day of the test, so the engine closed it on the same candle. It lost only its fees, $19.02, and the card still counts it.
A few engine fills differ slightly from Binance public closes; the 19 April 2026 exit filled at 73,795.01 against a close of 73,801.79. The figures above are the engine's own. In the Trades tab, order rows 15 and 16 hold the best trade, and rows 17 and 18 hold the last one.
Why 9 Trades Is a Description, Not Proof
The rule lost less than holding but still lost money, and nine trades are far too few to rate it. The Buy and Hold card is no better placed: it shows QUALITY 11 next to "Statistically inconclusive" (1 trade · needs 50+ to rate).
For a longer view, here is one context line on a different window, 2021-08-01 to 2026-08-01, so do not compare it directly with the table above. Over those five years, BTC RMA 50 Close Cross 1D 2021-2026 returned 208.24% over 34 trades, while BTC Buy and Hold 1D 2021-2026 returned 57.33%. That run is still under 50 trades, and it ends on 1 August 2026, three months before the end of the window tested here.
Read the drawdown figures with care too: how to read Max Drawdown explains why the worst fall can matter more than the return. For the bigger cycle question, see whether you can trade Bitcoin's long cycle, and for buying deep dips instead, what worked in past 50% Bitcoin drawdowns.
What This Test Cannot Tell You
This is one fall and one setting, so keep the limits in view:
- One window: 6 October 2025 to 1 November 2026, starting on the day of the high. A different start date would give different trades.
- One setting: RMA 50 only. Faster or slower averages were not tested.
- Costs: fees included at 0.1% per side; no slippage modelled.
- Structure: long only, one position at a time, no leverage.
- Small sample: nine trades describe what happened; they do not predict what comes next.
For more on rules against holding across several strategies, see active trading vs buy and hold in crypto.
The Practical Lesson
- A trend rule can sit out a fall: this one was in the market 28.83% of the time and lost 5.00% while holding lost 37.27%.
- Sitting out is not winning: the rule still ended below $10,000, and most of its trades lost.
- Test longer before trusting it: nine trades over one fall prove little, so run the same rule over a longer window first.
In CoinQuant you can write the same rule in plain words, swap RMA 50 for another average or period and test it on other coins or timeframes.
Build trading strategies on real data. No coding required.
Frequently Asked Questions
How far is Bitcoin below its all-time high?
At the 1 November 2026 close of 78,354.00, Bitcoin was 37.15% below its highest daily close of 124,658.54 from 6 October 2025, on Binance BTCUSDT daily candles.
How many days since Bitcoin's all-time high?
The high came on the 6 October 2025 candle. There are 391 days from 6 October 2025 to 1 November 2026, the end of this test; for a later date, add the days since 1 November 2026.
Did a trend rule lose less than holding?
Yes, in this test. BTC RMA 50 Close Cross 1D Oct 2025-Nov 2026 lost 5.00% over nine trades, while BTC Buy and Hold 1D Oct 2025-Nov 2026 lost 37.27%, fees included, but the rule still lost money and its sample is "Statistically inconclusive".
Test the same rule from the high, or try your own average and period.
Disclaimer:
Key Takeaway