
Can You Trade Bitcoin's Four-Year Cycle? What One Five-Year Backtest Can and Cannot Tell You

The question traders keep asking is simple: is there a Bitcoin four-year cycle trading strategy that actually works? We tested a simple version, a slow EMA 50/200 trend rule on BTC, and it returned 216.65% after fees from January 2021 to August 2026. It did that with only three trades, and one of them made more than the whole profit.
That is the real lesson. A rule slow enough to follow a cycle trades so rarely that a backtest has almost nothing to judge it on: the results card marks the run "Statistically inconclusive". The Max Drawdown along the way was 49.46%.
This guide explains the cycle, the debate about whether it is fading and what a backtest of a cycle rule can prove. The author ran the backtest on CoinQuant and reports the results without adjustment.
What the Bitcoin Four-Year Cycle Is
Bitcoin's new supply runs on a fixed clock. The Bitcoin Wiki describes it plainly: the coins paid per block are set to fall by "a 50% reduction every 210,000 blocks, or approximately four years". Each cut is called a halving.
| Halving | Date reached | Block |
|---|---|---|
| First | 2012-11-28 | 210,000 |
| Second | 2016-07-09 | 420,000 |
| Third | 2020-05-11 | 630,000 |
| Fourth | 2024-04-20 | 840,000 |
| Next | No date in the table | 1,050,000 |
The four-year cycle traders talk about is something else: a price pattern people saw around those dates. A September 2026 analysis by TurboStrategy separates the two. It calls the price cycle "an observation, not a protocol rule: a halving, a strong bull market, a peak and then a deep drawdown."
So a Bitcoin four-year cycle trading strategy is any rule that tries to be long through the bull phase after a halving and out before the deep drawdown. In CoinQuant, an AI trading platform, you can write a rule like that in plain English and backtest it on historical BTC data, with no coding required. What no backtest can do is give you more cycles than history holds.
Is the Cycle Weakening?
Is the four-year cycle dead? TurboStrategy's answer is no, but with a caveat that matters for traders: "Bitcoin's issuance cycle remains intact, while its price cycle appears weaker, more financialized and less dependable as a standalone forecast."
Its September 2026 analysis lists evidence on both sides:
- Timing still lined up: it says Bitcoin's October 6, 2025 high "arrived 534 days after the 2024 halving", close to the gaps after the 2016 and 2020 halvings.
- The shape changed: Bitcoin "reached a record high in March 2024, more than a month before the subsidy reduction", which earlier cycles did not do.
- The sample is tiny: "With only three completed post-halving market cycles, the pattern has always contained less evidence than its popularity suggests."
The next halving date is not fixed either. TurboStrategy writes that it "is expected around 2028, but its exact date depends on block production", and the Bitcoin Wiki supply table lists block 1,050,000 with no date reached. Nothing in this article forecasts a price.
A Bitcoin Four-Year Cycle Trading Strategy: EMA 50 Crosses EMA 200
The rule tested here does not use halving dates. It uses a slow trend signal that tends to stay long through long advances and out through long declines, which is what a cycle trader wants. The example is AI EMA 50/200 1D Trend Strategy from the author's CoinQuant strategy library.
Written as you would type it into CoinQuant:
Buy BTCUSDT on the daily chart when the EMA (period 50) of the close crosses above the EMA (period 200) of the close. Sell when the EMA (period 50) crosses back below the EMA (period 200). Test from January 1, 2021 to August 1, 2026 with $10,000, 100% of equity per trade and a 0.1% fee.
| Parameter | Setting |
|---|---|
| Strategy | AI EMA 50/200 1D Trend Strategy |
| Instrument | BTCUSDT (spot, Binance) |
| Data source | Kaiko via CoinQuant |
| Timeframe | Daily (1D) |
| Tested window | 2021-01-01 to 2026-08-01 |
| Entry | EMA 50 of the close crosses above EMA 200 of the close |
| Exit | EMA 50 crosses below EMA 200 |
| Direction | Long only, no leverage |
| Initial capital | $10,000 |
| Position size | 100% of equity per entry |
| Fees | 0.1% on entry and 0.1% on exit (no slippage set) |
The backtest returned a Total Return of 216.65%, with $10,000 growing to $31,664.87, and a Sharpe Ratio of 0.74. With three trades, the results card on the Performance tab marks the run "Statistically inconclusive" and notes that it needs 50+ trades to rate.
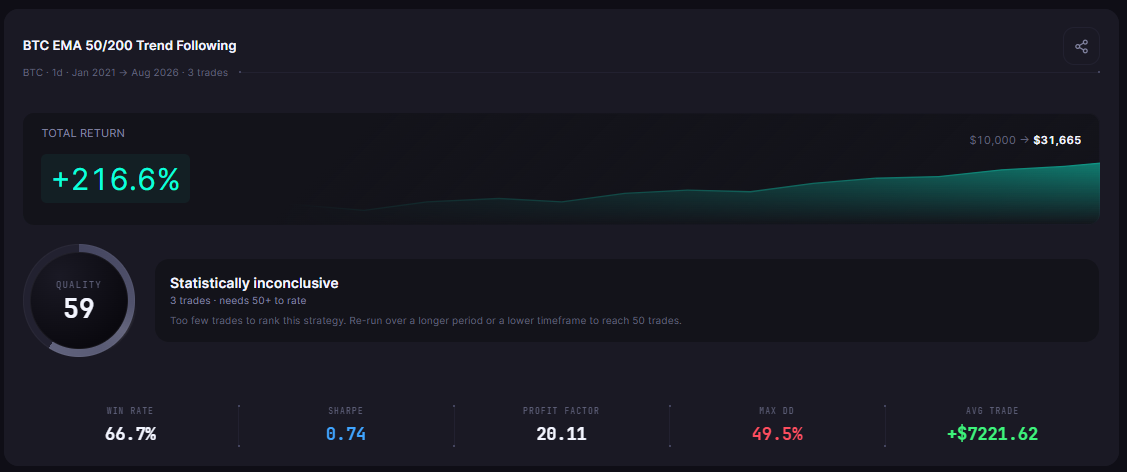
AI EMA 50/200 1D Trend Strategy on BTC: three trades, +216.6%, $10,000 to $31,665, marked "Statistically inconclusive"
The 216.65% works out to a CAGR of 22.93%, the steady yearly growth rate that would reach the same final balance. The backtest data, not the card, also reports CoinQuant's Buy and Hold benchmark for the same window: 114.18%. That benchmark carries no fees, so it is a rough guide rather than a like for like comparison.
Three Trades in Five and a Half Years
The rule bought three times and sold three times. All figures below are after fees.
| Trade | Entry | Exit | Days held | Return after fees | Net P&L after fees |
|---|---|---|---|---|---|
| 1 | 2021-08-14 | 2022-01-10 | 149 | -11.34% | -$1,133.59 |
| 2 | 2023-02-18 | 2023-09-24 | 218 | +6.36% | +$563.53 |
| 3 | 2023-10-03 | 2025-11-17 | 776 | +235.79% | +$22,234.93 |
The third trade made $22,234.93, which is 102.63% of the run's $21,664.87 net profit. The first two trades together lost $570.06, so without that one ride the rule would have finished below its starting capital.
The third trade was open across the 2024-04-20 halving, the only halving inside the window, so the rule did hold BTC through one advance after a halving. That is one event, not a pattern.
The Trades tab lists all of it in six rows. The log numbers orders, not trades: each trade is an Entry row and an Exit row, and the Exit row carries the trade's Net PnL after both fees. Times are UTC.
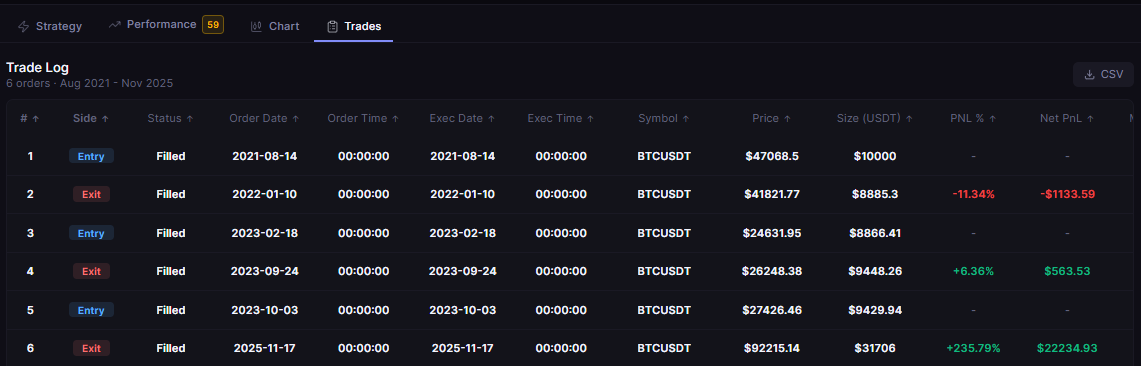
AI EMA 50/200 1D Trend Strategy trade log: six orders in order rows 1 to 6, Entry and Exit rows from August 2021 to November 2025, all Filled (times UTC)
What Three Trades Can and Cannot Prove
Three trades cannot prove or disprove a four-year cycle. That is the sample size problem with any Bitcoin halving cycle backtest: this window holds one halving, so the test sees one cycle at most.
| What this test can show | What it cannot show |
|---|---|
| How a slow EMA 50/200 rule behaved on BTC from 2021 to 2026, after fees | That the rule will catch the next cycle |
| That one trade made 102.63% of the net profit | Whether that trade reflects an edge or one lucky ride |
| That the account fell 49.46% from a peak along the way | That the four-year cycle still works, or that it is over |
A backtest needs many decisions before its numbers mean much, and the results card does not rate a run until it has 50 trades. For how much history a test needs, see how much historical data you need for a reliable crypto backtest. For why one rule can shine in one phase and fail in the next, see understanding market regimes.
Common Mistakes When Testing a Cycle Idea
- Reading one trade as a pattern: one winning ride says more about a market phase than about the rule.
- Picking the window around known peaks: starting or ending at a famous top or bottom can flatter a rule.
- Ignoring the drawdown: the rule was up overall, yet the account still fell 49.46% from a peak.
The Practical Lesson
- A cycle rule trades rarely: three trades in five and a half years, so the card says "Statistically inconclusive".
- One trade can be the whole result: the third trade made 102.63% of the net profit.
- The cycle itself is debated: the issuance clock is fixed; the price pattern is less certain.
To test a cycle idea yourself:
- Write the rule in plain English as in the quote above, then backtest it on the longest BTC window you can.
- Check the trade count first. Under 50 trades, treat the result as a story, not evidence.
- Check how much of the profit came from the best trade.
- Run a faster version of the same idea to see whether the logic holds across more trades, as in this EMA 20/50 vs EMA 50/200 test on Bitcoin.
Build trading strategies on real data. No coding required.
Frequently Asked Questions
What is the Bitcoin four-year cycle?
It has two parts: the halving, which cuts new BTC per block in half every 210,000 blocks (roughly every four years), and the price pattern of a bull run, peak and deep drawdown seen after past halvings.
When is the next Bitcoin halving?
The Bitcoin Wiki supply table lists the next halving at block 1,050,000, with no date reached yet. TurboStrategy writes that it "is expected around 2028, but its exact date depends on block production".
Does the four-year cycle still work?
The issuance clock does. Whether the price pattern still holds is debated, and a backtest cannot settle it: our EMA 50/200 test made three trades, too few to prove or disprove a four-year cycle.
Write your own cycle rule in plain English and see how many trades it really makes.
Backtest your strategy on CoinQuant (https://app.coinquant.ai/?ref=NSfBKvpv)
Disclaimer:
Key Takeaway