
Time in the Market vs Timing the Market: What Five Years of Crypto Backtests Show (2021-2026)

Time in market vs timing the market is an old argument: stay invested, or step in and out with a rule. This article tests it on CoinQuant with three crypto pairs from August 2021 to August 2026. In each pair a simple trend rule held its coin only 34.27% to 47.67% of the time, and each rule had a shallower worst fall than holding.
Holding still earned more on two of the three coins. Solana held for the whole window returned 110.02%, against 0.78% for its rule. On Cardano both lost, and the rule lost less: -54.01% against -86.76%.
The author ran every backtest in this article on CoinQuant, with the same window, capital and 0.1% fee for each pair. This article reports the results without adjustment and declares no winner up front.
Time in Market vs Timing the Market: What We Compare and How
Each pair sets one rule against holding the same coin, with the same window, capital, sizing and fee, so the only difference is when the money is in the market. The comparison uses three measures:
- Time in Market: the share of the window the strategy held a position.
- Total Return: what $10,000 became after fees.
- Max Drawdown: the deepest fall from a peak in the account balance.
Every run starts with $10,000, uses 100% of equity per entry, trades long only and pays a 0.1% fee on entry and exit. No slippage was modelled.
Where the Saying Comes From
"Time in the market beats timing the market" is a stock investing saying: an investor who stays in collects the long run gain, while one who jumps in and out can miss the days that matter most.
Crypto is a harder test. Holding each of these three coins meant sitting through a fall of more than three quarters at some point, so a rule that steps aside has more to gain. The question is whether that gain outweighs the rallies it misses.
Time in Market, Defined
Time in Market is the share of the test window during which a strategy holds a position. Buy and Hold buys on the first bar and sells on the last, so it scores 100.00%.
CoinQuant reports Time in Market for each backtest through its API, not on the results card, so the figures below come from the API. A time in market percentage backtest check shows how much of the window a rule had to earn its return.
Three Pairs: A Rule vs Holding the Same Coin
The three rules are plain trend rules. Two use Aroon, which CoinQuant's Supported Elements page says "measures how recently price hit a new high or low to tell you if a trend is starting, strong, or fading." The third uses the Adaptive Moving Average.
SOL: Aroon 14 vs Holding
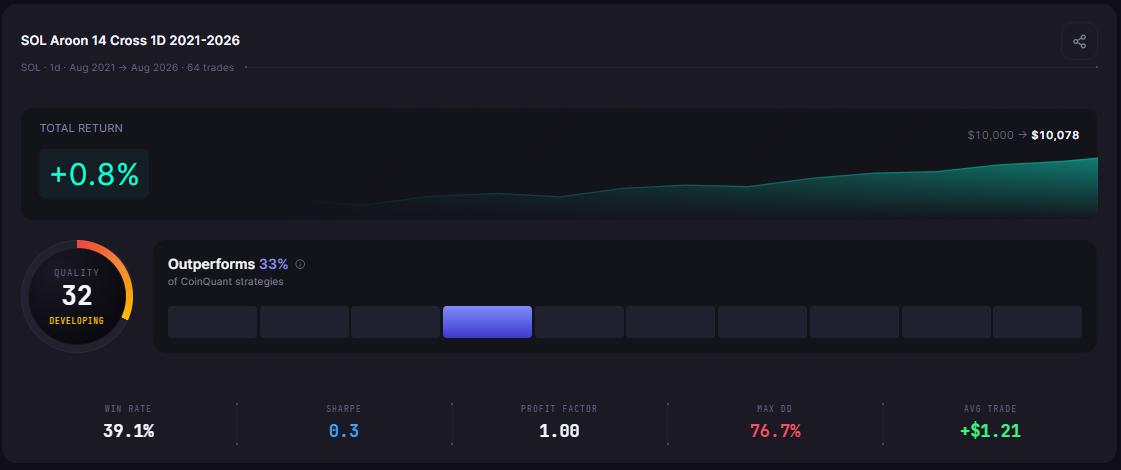
The rule buys SOL when Aroon Up (14) crosses above Aroon Down (14) and sells when it crosses back below.
| Metric | SOL rule | SOL Buy and Hold |
|---|---|---|
| Strategy | SOL Aroon 14 Cross 1D 2021-2026 | SOL Buy and Hold 1D 2021-2026 |
| Time in Market | 47.67% | 100.00% |
| Total Return | 0.78% | 110.02% |
| Max Drawdown | 76.72% | 96.27% |
| Total Trades | 64 | 1 |
| Total Fees | $1,897.93 | $31.01 |
With 64 trades, the rule's results card on the Performance tab shows a QUALITY of 32 and an "Outperforms" line that ranks the run against other CoinQuant strategies.
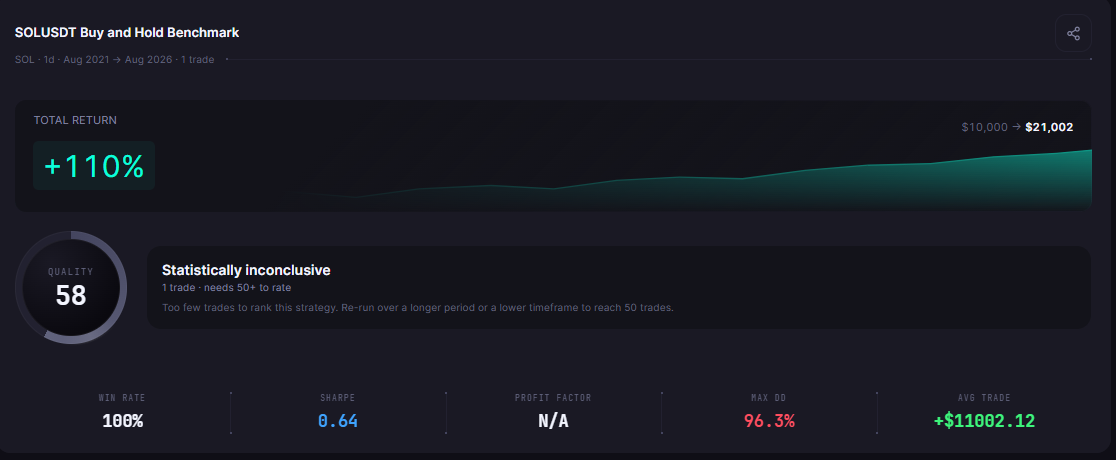
Holding SOL rode a 96.27% fall, from its peak on 6 November 2021 to its low on 29 December 2022, and still ended with more than twice its stake. Its card header reads "SOLUSDT Buy and Hold Benchmark", the name saved with SOL Buy and Hold 1D 2021-2026, which pays the 0.1% fee on entry and exit and ends at 110.02%. The platform's separate Buy and Hold benchmark carries no fees and ends at 110.44% over the same window.
ADA: Adaptive Moving Average 10 vs Holding
The rule buys ADA when the daily close crosses above the Adaptive Moving Average (10) and sells when it crosses below. The same page calls it "a self-adjusting moving average that moves fast in clean trends and slows down in choppy markets to cut out noise."
| Metric | ADA rule | ADA Buy and Hold |
|---|---|---|
| Strategy | ADA AMA 10 Close Cross 1D 2021-2026 | ADA Buy and Hold 1D 2021-2026 |
| Time in Market | 34.27% | 100.00% |
| Total Return | -54.01% | -86.76% |
| Max Drawdown | 80.51% | 95.15% |
| Total Trades | 104 | 1 |
| Total Fees | $1,546.40 | $11.32 |
The rule spent the least time in the market of the three and still lost more than half its stake. For a closer look at this record, see Adaptive Moving Average Strategy on Cardano: Can an Adaptive Trend Rule Survive an 87% Decline? (2021-2026).
XRP: Aroon 25 vs Holding
The same Aroon cross as on SOL, with a period of 25.
| Metric | XRP rule | XRP Buy and Hold |
|---|---|---|
| Strategy | XRP Aroon 25 Cross 1D 2021-2026 | XRP Buy and Hold 1D 2021-2026 |
| Time in Market | 43.52% | 100.00% |
| Total Return | -17.32% | 46.13% |
| Max Drawdown | 65.23% | 77.87% |
| Total Trades | 43 | 1 |
| Total Fees | $718.04 | $24.62 |
With 43 trades, the rule's card shows its QUALITY number, 30, next to "Statistically inconclusive" (43 trades · needs 50+ to rate). The same record faced one crash day in How a Trend Strategy Handled the October 10, 2025 Crypto Crash: An XRP Aroon Stress Test (2021-2026).
When Timing Helped and When It Hurt
| Pair | Higher Total Return | Shallower Max Drawdown |
|---|---|---|
| SOL | Holding (110.02% vs 0.78%) | Rule (76.72% vs 96.27%) |
| ADA | Rule (-54.01% vs -86.76%, both lost) | Rule (80.51% vs 95.15%) |
| XRP | Holding (46.13% vs -17.32%) | Rule (65.23% vs 77.87%) |
- Drawdown: timing helped every time. Each rule's worst fall was shallower, by 12.64 to 19.55 percentage points.
- Return, ADA: on a coin that lost most of its value, being out two thirds of the time cut the loss.
- Return, SOL and XRP: holding finished well ahead; what the rules saved by stepping aside was less than what they missed and paid in fees.
Where Each Side Is Better
Neither side wins on every measure.
| Question | Time in the market (holding) | Timing the market (a rule) |
|---|---|---|
| Missed rallies | None: always invested | Some: out more than half the time |
| Worst fall | Deeper: 77.87% to 96.27% in these tests | Shallower: 65.23% to 80.51% in these tests |
| Fees | One buy and one sell: $11.32 to $31.01 here | $718.04 to $1,897.93 here |
| Decisions | None after the first buy | One on every signal |
| Verdict in these CoinQuant backtests | Higher Total Return on SOL and XRP | Shallower worst fall in all three pairs; higher Total Return only on ADA, where both lost |
Holding catches every rally but sits through every fall, as SOL and ADA show. A rule cuts the worst falls and pays for that in fees and missed gains. For how to read a drawdown, see Maximum Drawdown in Crypto Trading: How to Read It and Why It Matters More Than Returns. For five more rules against holding, see Active Trading vs Buy and Hold in Crypto: What 5 Backtested Strategies Show (2021-2026).
What This Test Cannot Tell You
Three rules on three coins is a small set; other rules could land on either side.
- Costs: fees included, no slippage modelled. Each trade pays 0.1% on entry and 0.1% on exit.
- Direction: long only, one position, no leverage. No rule shorts the falls it sits out.
- Window: 2021-08-01 to 2026-08-01, past data only, with no claim about any later period.
- Sample: the XRP rule has 43 trades and is "Statistically inconclusive", and each hold is a single trade.
- Data note: the ADA rule's second trade (11 to 15 September 2021) spans a gap in the ADAUSDT daily data (12 to 14 September 2021), and the ADA and XRP holds span the ADAUSDT and XRPUSDT gaps (XRPUSDT: 9 to 15 September 2021). The platform does not flag either gap.
Past results do not predict future results.
The Practical Lesson
- Timing cut the worst falls: every rule's Max Drawdown was shallower than holding the same coin.
- Holding won on return twice: 110.02% against 0.78% on SOL and 46.13% against -17.32% on XRP.
- Trading costs fees: $1,897.93 for the SOL rule against $31.01 for holding SOL.
Stepping aside can cut the worst falls, but it can also miss the gains. In CoinQuant, an AI trading platform, you can write a rule in plain English with no coding required and test it against holding the same coin on the same window before you choose either.
Build trading strategies on real data. No coding required.
Frequently Asked Questions
Does time in the market beat timing the market in crypto?
On return it did for two of three coins tested: holding SOL and XRP beat their rules from 2021-08-01 to 2026-08-01. On drawdown, timing won all three pairs. Which matters more depends on whether you can sit through falls like the 96.27% that holding SOL took.
What is time in market in a backtest?
It is the share of the test window during which the strategy held a position. Buy and Hold scores 100.00%. The three rules here scored 47.67% (SOL), 34.27% (ADA) and 43.52% (XRP).
Is buy and hold better than trading?
Not always. In these CoinQuant backtests holding earned more on SOL and XRP, while the ADA rule lost less than holding. Test both on the same coin, with fees included, before you decide.
Test a rule against holding your own coin on the same window, with fees included.
Disclaimer:
This content is for educational and informational purposes only and does not constitute financial, investment, or trading advice. All strategies and examples are for illustrative purposes and do not guarantee results. Always conduct your own research before making financial decisions.