
Adaptive Moving Average Strategy on Cardano: Can an Adaptive Trend Rule Survive an 87% Decline? (2021-2026)
Is an adaptive moving average strategy crypto traders can build without code enough to survive five years in which simply holding the coin lost 86.76%? We tested ADA AMA 10 Close Cross 1D 2021-2026 on daily Cardano bars from 2021-08-01 to 2026-08-01. It lost 54.01% across 104 trades, while ADA Buy and Hold 1D 2021-2026 lost 86.76% on the same window and fee.
So the rule lost less than holding, and its Max Drawdown was shallower (80.51% vs 95.15%). But the trade log shows the adaptive average did not stop the whipsaws. Of the 104 trades, 57 closed within three daily bars, and together they netted -$19,916.08 after fees.
The author ran every backtest on CoinQuant, an AI trading platform. This article reports the results without adjustment. No tuned parameters, no cherry picked dates.
What an Adaptive Moving Average Is
An adaptive moving average changes its own speed. CoinQuant's Supported Elements page puts it this way: "AMA is a self-adjusting moving average that moves fast in clean trends and slows down in choppy markets to cut out noise."
The same page names the method: "AMA (Kaufman's Adaptive Moving Average, also called KAMA) measures the average price like other moving averages, but it constantly adjusts its speed using the Efficiency Ratio (ER)." In plain words, the Efficiency Ratio compares how far price actually travelled with how much it zigzagged on the way. A clean trend scores high and the average speeds up; a choppy market scores low and the average almost stops.
StockCharts, an independent charting site, describes the same indicator in its ChartSchool guide to KAMA: "Developed by Perry Kaufman, Kaufman's Adaptive Moving Average (KAMA) is a moving average designed to account for market noise or volatility."
- The promise: fewer false crossovers in chop, less lag in trends.
- The source of its speed: the Efficiency Ratio, which our Efficiency Ratio strategy backtest on Ethereum tests on its own.
- A close relative: VIDYA, another adaptive average, covered in the VIDYA strategy backtest on Ethereum.
That makes a coin that spent years drifting lower a fair test for a Kaufman adaptive moving average strategy. If the slowdown in chop works, it should keep the rule out of most false starts.
The Rule: Daily Close Crosses the 10-Period AMA
The rule is the simplest way to use the indicator:
- Entry: buy ADAUSDT with 100% of equity when the daily close crosses above the 10-period AMA of the close.
- Exit: sell when the daily close crosses below the same AMA.
- Nothing else: no stop loss, no take profit, no filter, one position at a time.
| Parameter | Setting |
|---|---|
| Strategy | ADA AMA 10 Close Cross 1D 2021-2026 |
| Instrument | ADAUSDT (spot, Binance) |
| Data source | Kaiko via CoinQuant |
| Timeframe | Daily (1D) |
| Tested window | 2021-08-01 to 2026-08-01 |
| First trade to last exit | 2021-08-18 to 2026-08-01 |
| AMA settings | Period 10, source Close |
| Entry | Daily close crosses above AMA(10) |
| Exit | Daily close crosses below AMA(10) |
| Direction | Long only, no leverage |
| Initial capital | $10,000 |
| Position size | 100% of equity per entry |
| Fees | 0.1% on entry and 0.1% on exit (no slippage modelled) |
| Baselines (same window) | ADA Buy and Hold 1D 2021-2026; BTC Buy and Hold 1D 2021-2026 |
No slippage was modelled, so real fills could differ.
Adaptive Moving Average Strategy: Crypto Results From Five Years on Cardano
ADA AMA 10 Close Cross 1D 2021-2026 turned $10,000 into $4,599.36, a Total Return of -54.01%. It won 21 of its 104 trades, a Win Rate of 20.19%, with a Profit Factor of 0.85 and a Max Drawdown of 80.51%. Fees cost $1,546.40, and the Sharpe Ratio was -0.03.
Data note: ADAUSDT daily data on CoinQuant is missing 2021-09-12 to 2021-09-14, and the platform does not flag the gap. One trade spans it: it entered on 2021-09-11 and exited on 2021-09-15, the first bar after the gap, for -6.93% after fees (-$825.63).
Most trades were small losers. The median trade lost $190.69 after fees, while the best one, from 6 November to 9 December 2024, made $11,465.07 after fees. The rule was in the market 34.27% of the time. Because the run clears 50 trades, its results card is not marked "Statistically inconclusive".
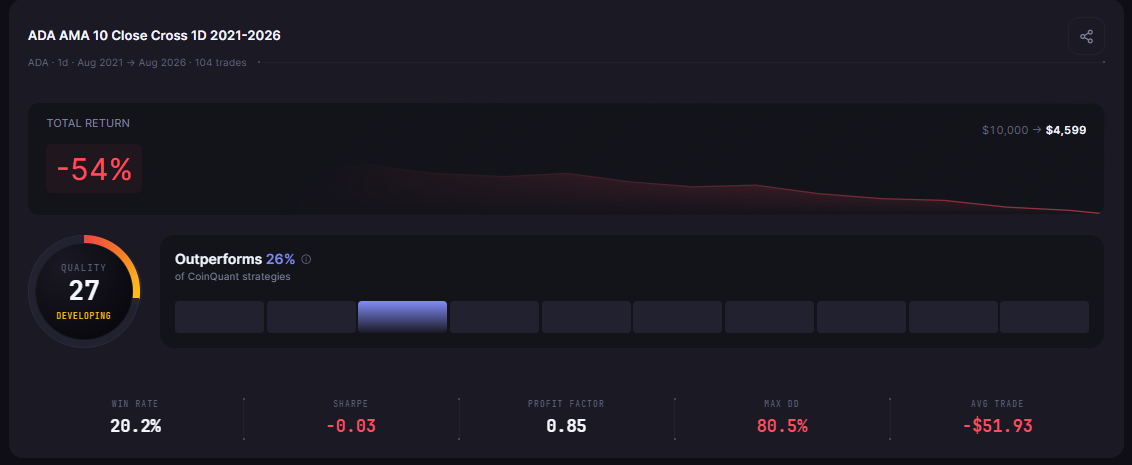
ADA AMA 10 Close Cross 1D 2021-2026 results card: five years of daily Cardano bars, 104 trades, -54%, $10,000 to $4,599, Quality score 27.
Buy and Hold Comparison: ADA Held on the Same Window and Fee
The baseline is ADA Buy and Hold 1D 2021-2026, a separate library strategy that buys on the first bar, holds to the end and pays the same 0.1% fee on entry and exit. BTC Buy and Hold 1D 2021-2026 is the BTC Spot Comparison.
| Metric | AMA rule | ADA held | BTC Spot Comparison |
|---|---|---|---|
| Strategy | ADA AMA 10 Close Cross 1D 2021-2026 | ADA Buy and Hold 1D 2021-2026 | BTC Buy and Hold 1D 2021-2026 |
| Total Return | -54.01% | -86.76% | 57.33% |
| Final Balance | $4,599.36 | $1,324.39 | $15,733.43 |
| Total Trades | 104 | 1 | 1 |
| Win Rate | 20.19% (21W / 83L) | n/a (single hold) | n/a (single hold) |
| Profit Factor | 0.85 | n/a (single hold) | n/a (single hold) |
| Sharpe Ratio | -0.03 | -0.02 | 0.44 |
| Max Drawdown | 80.51% | 95.15% | 76.63% |
| CAGR | -14.38% | -33.24% | 9.48% |
| Total Fees | $1,546.40 | $11.32 | $25.74 |
All three runs share the same window, capital, sizing and fee. CAGR is the steady yearly rate that would produce each final balance. Each Buy and Hold run is a single trade, so its card is "Statistically inconclusive".
The "87% decline" in the title is ADA Buy and Hold's Total Return, -86.76%, rounded. The deepest fall from a peak was larger: a Max Drawdown of 95.15%. Against that, the AMA rule kept more of the account, but it still lost more than half, while holding BTC on the same window returned 57.33%.
Whipsaws in the Trade Log
The Supported Elements page lists "Fewer whipsaws: the slowdown in chop cuts false crossover signals." among the reasons traders use AMA. The trade log is where that claim can be checked, and on this coin it did not hold up well. The median trade lasted three daily bars.
Labelled arithmetic on the Trades tab rows: the 57 trades that closed within three bars netted -$19,916.08 after fees; 56 of them lost, and those 56 lost $20,031.07 between them. The only short winner was the last trade, which opened on 30 July 2026 and was closed by the end of the test.
The worst stretch came early. From September 2021 to February 2022, eight trades in a row closed within three bars, and all eight lost:
| Entry (UTC) | Exit (UTC) | Order rows | Net PnL after fees |
|---|---|---|---|
| 2021-09-11 | 2021-09-15 | 3 and 4 | -$825.63 |
| 2021-11-08 | 2021-11-10 | 5 and 6 | -$168.10 |
| 2021-12-02 | 2021-12-03 | 7 and 8 | -$1,056.06 |
| 2021-12-23 | 2021-12-24 | 9 and 10 | -$574.17 |
| 2021-12-25 | 2021-12-28 | 11 and 12 | -$350.92 |
| 2022-01-12 | 2022-01-13 | 13 and 14 | -$555.57 |
| 2022-01-16 | 2022-01-19 | 15 and 16 | -$450.38 |
| 2022-02-04 | 2022-02-05 | 17 and 18 | -$106.41 |
The first of these is the trade that spans the data gap. A 10-period AMA reacts within days, and on a coin that kept reversing, the close kept crossing it.
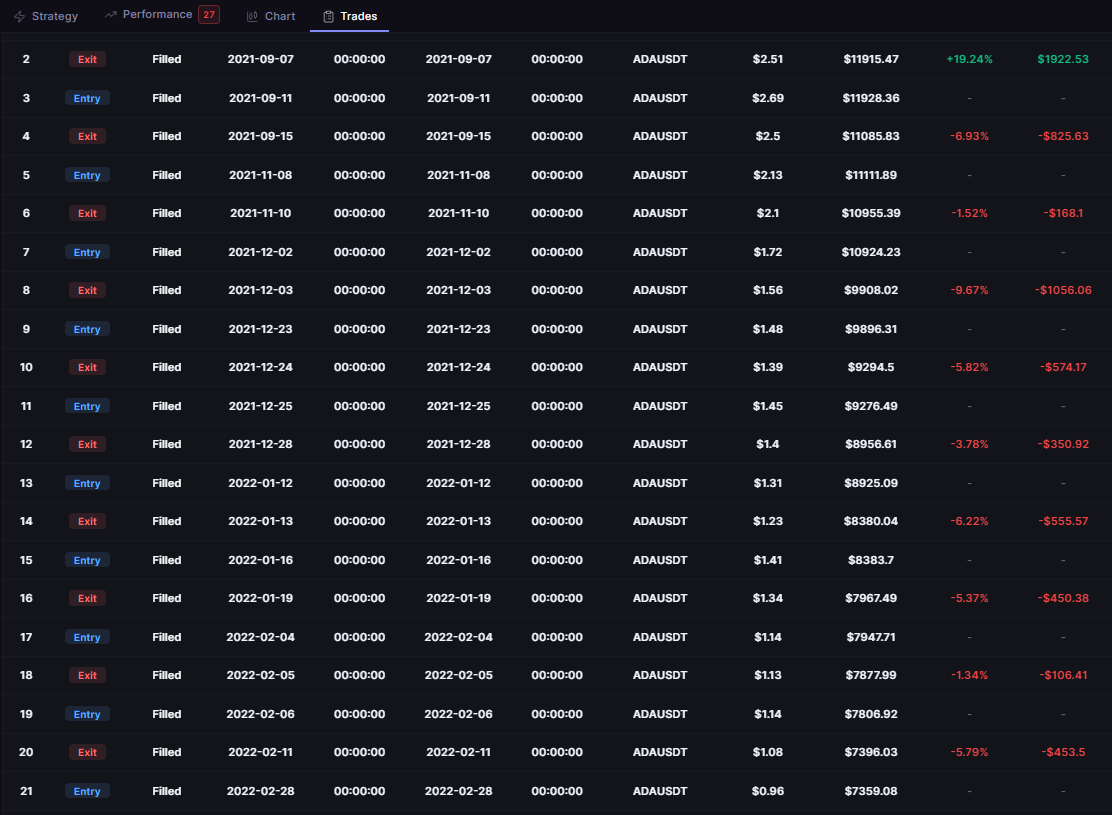
ADA AMA 10 Close Cross 1D 2021-2026 trade log, times in UTC: order rows 3 to 18, eight Filled Entry and Exit pairs from 11 September 2021 to 5 February 2022, each Exit row showing a loss.
What This Test Cannot Tell You
This is one ADA adaptive moving average test, not a verdict on the indicator:
- Scope: one coin, one period setting (10), one window, daily bars.
- Costs: a 0.1% fee on every fill and no slippage modelled.
- A hard market: a coin in long decline is a tough test for any long only rule, adaptive or not.
- No control: we did not run a simple moving average on the same data, so this test cannot say whether AMA beat it.
A longer AMA period or a trend filter might change the picture, and each would need its own test. For how trend rules cope in sideways markets in general, see trend-following crypto strategy backtested in a sideways market.
The Practical Lesson
- Losing less is not winning: the AMA rule beat holding ADA (-54.01% vs -86.76%) and still lost more than half.
- Check the claim in the log: "fewer whipsaws" did not show up here; 57 trades closed within three bars and netted -$19,916.08.
- Compare with BTC too: holding BTC returned 57.33% on the same window.
Next, keep the rule and change one thing at a time, such as the AMA period or the coin, and read the short trades in each log. That turns a KAMA crypto backtest from one result into evidence.
Build trading strategies on real data. No coding required.
Frequently Asked Questions
What is an adaptive moving average?
A moving average that changes its speed with market conditions. CoinQuant's Supported Elements page describes AMA, also called KAMA, as moving fast in clean trends and slowing down in choppy markets, using the Efficiency Ratio to set its speed.
Does an adaptive moving average reduce whipsaws?
Not enough in this test. On daily Cardano bars, the 57 trades that closed within three bars netted -$19,916.08 after fees, and 56 of them lost.
Is AMA better than a simple moving average for crypto?
This test cannot say, because it did not run a simple moving average on the same data. It shows only that a 10-period AMA cross lost 54.01% on ADA from 2021 to 2026, less than holding ADA (-86.76%).
Try the AMA on your own coin and window, then read the short trades in its log.
Disclaimer:
Key Takeaway