
How a Trend Strategy Handled the October 10, 2025 Crypto Crash: An XRP Aroon Stress Test (2021-2026)
A stress test trading strategy check asks one plain question: what did a fixed rule do on a day everyone remembers? We took XRP Aroon 25 Cross 1D 2021-2026 through the October 10, 2025 crypto crash and read its trade log. The answer is that the rule was already out of the market. It sold on 22 September 2025 and did not buy again until 4 November 2025.
Sitting out one bad day did not make it a good strategy. Over five years of daily XRP bars it lost 17.32% across 43 trades, while holding XRP returned 46.13% on the same window and fee. With fewer than 50 trades, its results card marks the run "Statistically inconclusive".
The author ran every backtest on CoinQuant, an AI trading platform. This article reports the results without adjustment. No tuned parameters, no cherry picked dates.
How to Stress Test Trading Strategy Rules, and What a Daily Backtest Can Show
A stress test takes one fixed rule and asks what it did through a known bad stretch. You run it as written, without changing it to fit the event, and read the log.
The October 10, 2025 crash is a good exam because it is dated and well documented. BIT's Knowledge Hub writes that "the 10/10 crash wiped out about $19 billion in leveraged positions". CoinDesk, writing on 8 October 2026 as the anniversary neared, said much of bitcoin's fall that day happened "in a matter of minutes in thin Friday evening (U.S. time) trade".
That second point sets the limit of this test. A daily backtest sees where each day closed, not how far price fell inside the day.
- It can answer: was the rule in or out on the day, what the nearby trades returned after fees and how the full run compares with holding the coin.
- It cannot answer: the intraday low, where a stop would have filled or what the rule will do in the next crash.
The Rule: Aroon Up and Aroon Down Crossovers (Period 25)
Aroon tracks how recently price made a new high and a new low inside a lookback window. CoinQuant's Supported Elements page describes two lines, Aroon Up and Aroon Down, each running from 0 to 100. It also says: "Clear crossovers: Aroon Up crossing above Aroon Down is a classic bullish cue."
This XRP Aroon backtest uses exactly that cue and its reverse:
- Entry: buy XRPUSDT with 100% of equity when Aroon Up (period 25) crosses above Aroon Down (period 25).
- Exit: sell when Aroon Up (period 25) crosses below Aroon Down (period 25).
- Nothing else: no stop loss, no take profit, no filter, one position at a time.
| Parameter | Setting |
|---|---|
| Strategy | XRP Aroon 25 Cross 1D 2021-2026 |
| Instrument | XRPUSDT (spot, Binance) |
| Data source | Kaiko via CoinQuant |
| Timeframe | Daily (1D) |
| Tested window | 2021-08-01 to 2026-08-01 |
| First trade to last exit | 2021-10-10 to 2026-07-28 |
| Aroon settings | Period 25, Aroon Up vs Aroon Down |
| Entry | Aroon Up crosses above Aroon Down |
| Exit | Aroon Up crosses below Aroon Down |
| Direction | Long only, no leverage |
| Initial capital | $10,000 |
| Position size | 100% of equity per entry |
| Fees | 0.1% on entry and 0.1% on exit (no slippage modelled) |
| Baselines (same window) | XRP Buy and Hold 1D 2021-2026; BTC Buy and Hold 1D 2021-2026 |
No slippage was modelled, so fills in a fast market could differ. For the same indicator on Bitcoin, see the Aroon indicator strategy backtest on Bitcoin.
Five-Year Results on XRP
From 2021-08-01 to 2026-08-01, XRP Aroon 25 Cross 1D 2021-2026 turned $10,000 into $8,267.82, a Total Return of -17.32%. It made 43 trades and won 15 of them, for a Win Rate of 34.88% and a Profit Factor of 0.93. Max Drawdown was 65.23%, and fees cost $718.04 in total.
The pattern is many small losses and a few large wins. The median trade lost $302.96 after fees, while the best trade (7 November to 27 December 2024) made $10,055.49 after fees.
Data note: XRPUSDT daily data on CoinQuant is missing 2021-09-09 to 2021-09-15, and the platform does not flag the gap. No trade in this test spans it; the first entry came on 2021-10-10.
On the Performance tab, the results card marks this run "Statistically inconclusive": 43 trades, and it needs 50+ to rate. Treat it as one example, not a verdict on Aroon.
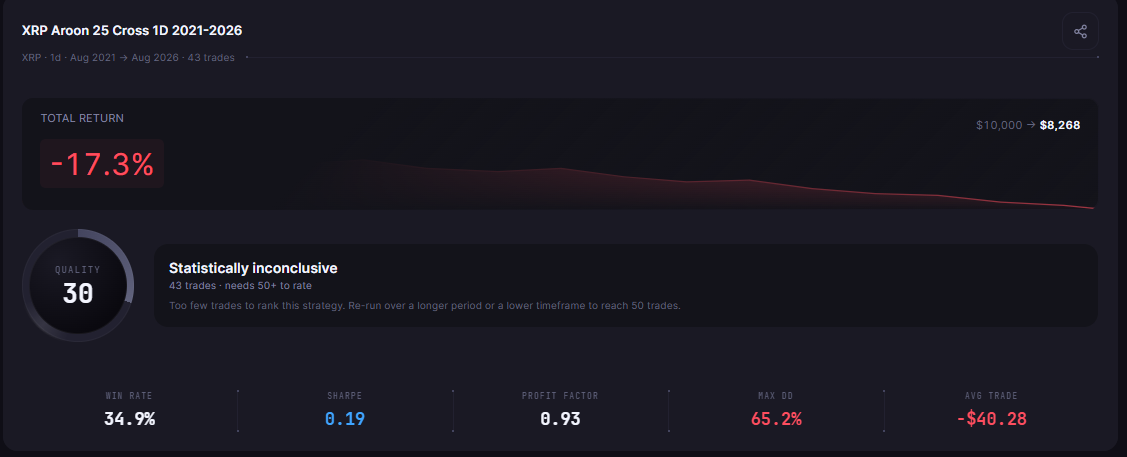
XRP Aroon 25 Cross 1D 2021-2026 results card: daily XRP from August 2021 to August 2026, 43 trades, -17.3%, $10,000 to $8,268, marked "Statistically inconclusive".
Buy and Hold Comparison: XRP Held on the Same Window and Fee
The baseline is XRP Buy and Hold 1D 2021-2026, a separate library strategy that buys on the first bar, holds to the end and pays the same 0.1% fee on entry and exit. BTC Buy and Hold 1D 2021-2026 is the BTC Spot Comparison.
| Metric | Aroon rule | XRP held | BTC Spot Comparison |
|---|---|---|---|
| Strategy | XRP Aroon 25 Cross 1D 2021-2026 | XRP Buy and Hold 1D 2021-2026 | BTC Buy and Hold 1D 2021-2026 |
| Total Return | -17.32% | 46.13% | 57.33% |
| Final Balance | $8,267.82 | $14,613.11 | $15,733.43 |
| Total Trades | 43 | 1 | 1 |
| Win Rate | 34.88% (15W / 28L) | n/a (single hold) | n/a (single hold) |
| Profit Factor | 0.93 | n/a (single hold) | n/a (single hold) |
| Sharpe Ratio | 0.19 | 0.49 | 0.44 |
| Max Drawdown | 65.23% | 77.87% | 76.63% |
| CAGR | -3.73% | 7.88% | 9.48% |
| Total Fees | $718.04 | $24.62 | $25.74 |
All three runs share the same window, capital, sizing and fee. CAGR is the steady yearly rate that would produce each final balance.
The Aroon rule trailed holding XRP on Total Return (-17.32% vs 46.13%), but its Max Drawdown was shallower (65.23% vs 77.87%). Holding BTC returned 57.33% with a 76.63% Max Drawdown. The shallower drawdown came with a loss, where holding either coin made a gain.
October 10, 2025 in the Trade Log
Here is the stress test itself. The rule's last trade before the crash bought XRP on 12 September 2025 and sold on 22 September 2025 for -8.33% after fees (-$1,288.06). It then held no position until it bought again on 4 November 2025.
| Period (UTC) | Order rows | Result after fees |
|---|---|---|
| 2025-08-18 to 2025-08-29 | 69 and 70 | -8.10% (-$1,362.79) |
| 2025-09-12 to 2025-09-22 | 71 and 72 | -8.33% (-$1,288.06) |
| 10 October 2025 | none | No position open |
| 2025-11-04 to 2025-12-17 | 73 and 74 | -15.72% (-$2,228.59) |

XRP Aroon 25 Cross 1D 2021-2026 trade log, times in UTC: order row 72 is a Filled Exit on 22 September 2025, and the next row, 73, is a Filled Entry on 4 November 2025, so no position was open on 10 October 2025.
Meanwhile, the XRP Buy and Hold 1D 2021-2026 baseline lost 15.41% between its daily balance points for 9 and 10 October 2025. That is a change between two daily points of a backtest, not an intraday low or a quoted price.
So the rule passed the narrow test: it was not holding XRP when the crash hit. The reason is unglamorous. The 22 September sale was an ordinary Aroon exit that closed its second short losing trade in a row, so being flat on 10 October was a side effect of a weak trend, not a crash forecast.
What This Test Cannot Tell You
One clean day proves little. Keep these limits in view:
- Scope: one coin, one rule (Aroon period 25), one window, daily bars.
- Costs: a 0.1% fee on every fill and no slippage modelled.
- Small sample: 43 trades, marked "Statistically inconclusive".
- One crash: being flat on 10 October 2025 says nothing about the next one.
This is also not a crypto flash crash strategy. Nothing in the rule reacts to a crash; it only follows Aroon crossovers. For when to get back in after a drop like this, read how to know when to buy again after a major crypto crash.
The Practical Lesson
- Read the log, not the headline: the rule was flat on 10 October 2025, yet it still lost 17.32% over five years.
- Judge the event inside the full run: one good day can hide a weak strategy, so compare it with holding the coin (46.13%) and with BTC (57.33%).
- Know your bar size: daily bars answer "in or out", not "how low".
To run your own stress test, describe a rule in plain English in CoinQuant, backtest it over a window that contains the crash you care about, then open the Trades tab and find the dates.
Build trading strategies on real data. No coding required.
Frequently Asked Questions
How do you stress test a trading strategy?
Run the rule exactly as written over a window that includes a known bad period, then read its trade log around those dates. Compare the full run with Buy and Hold on the same window and fee. Do not tweak the rule to fit the event.
What happened to crypto on October 10, 2025?
Prices fell hard in a short time, and BIT's Knowledge Hub writes that "the 10/10 crash wiped out about $19 billion in leveraged positions". In this test, the XRP Buy and Hold 1D 2021-2026 baseline lost 15.41% between its daily balance points for 9 and 10 October 2025.
Can a daily backtest show a flash crash?
Only partly. It shows where each daily bar closed and whether the rule held a position, but not the intraday low or how a stop would have filled. XRP Aroon 25 Cross 1D 2021-2026 had no position open on 10 October 2025.
Pick a crash date, pick a rule and check whether it was in or out.
Disclaimer:
Key Takeaway