
Whipsaw Trading: How to Measure False Crossover Signals in a Crypto Backtest and Test Fixes
Whipsaw trading is what happens when a signal fires, price reverses almost at once and the next signal closes the trade at a small loss. Repeat that dozens of times in a choppy market and the small losses, plus fees on every entry and exit, add up to a large one.
Crossover strategies are the usual victims. This guide measures whipsaws in two real CoinQuant Strategy Library backtests, then shows how to test fixes one at a time instead of guessing.
Whipsaw Trading: What It Looks Like in a Backtest
A whipsaw in trading leaves fingerprints in the results panel before you open a single chart. Look for several of these together:
| Symptom in the results | What it suggests |
|---|---|
| High trade count for the timeframe | The signal flips often, and every flip pays fees twice |
| Low win rate, well under half | Most signals reverse before a trend develops |
| Average win far above average loss, yet profit factor below 1.0 | The few trends caught cannot pay for the many false starts |
| Long losing streaks | Choppy stretches produce back to back false signals |
| Losing trades that close within a few bars | False crossover signals, cut almost immediately |
| Large total fees relative to starting capital | Churn, not edge |
One symptom alone proves little. Three or four at once is a whipsaw profile.
What Whipsaws Cost: ETH Hull MA Cross, 202 Trades
ETH Hull MA Cross 1D 2021-2026 is as simple as a crossover gets: buy when ETHUSDT closes above its 20-period Hull Moving Average and sell when it closes back below. The Hull average reacts quickly, which is exactly what exposes it to whipsaws.
The test used Binance spot data from Kaiko via CoinQuant, daily bars from August 1, 2021 to August 1, 2026, $10,000, 100% of equity per trade and a 0.1% taker fee on every fill. No slippage was set.
| Metric | Strategy | Buy and Hold |
|---|---|---|
| Strategy | ETH Hull MA Cross 1D 2021-2026 | ETH Buy and Hold 1D 2021-2026 |
| Total Trades | 202 | 1 |
| Win Rate | 28.71% | n/a (single hold) |
| Profit Factor | 0.89 | n/a |
| Average win | $673.10 | n/a |
| Average loss | $305.94 | n/a |
| Longest losing streak | 12 trades | n/a |
| Total fees | $3,394.92 | $17.20 |
| Total Return | -50.15% | -27.95% |
| Final balance | $4,984.92 | $7,205.03 |
| Max Drawdown | 67.70% | 79.30% |
Every fingerprint is here. The average win was more than double the average loss, a payoff ratio of 2.20, yet fewer than three in ten trades won. The profit factor landed at 0.89: every dollar lost brought back 89 cents.
Fees deepened the loss. The strategy paid $3,394.92 in fees on a $10,000 account and finished at $4,984.92, down 50.15%. Holding Ether lost 27.95% over the same window, so the whipsaws turned a falling market into a much worse result.
The trade log shows the mechanism. Of the 144 losing trades, 98 closed within three days, while the median winner was held eight days. The worst run, 12 straight losses, came between April and June 2022: as ETH slid, each short bounce above the Hull line triggered an entry that failed.
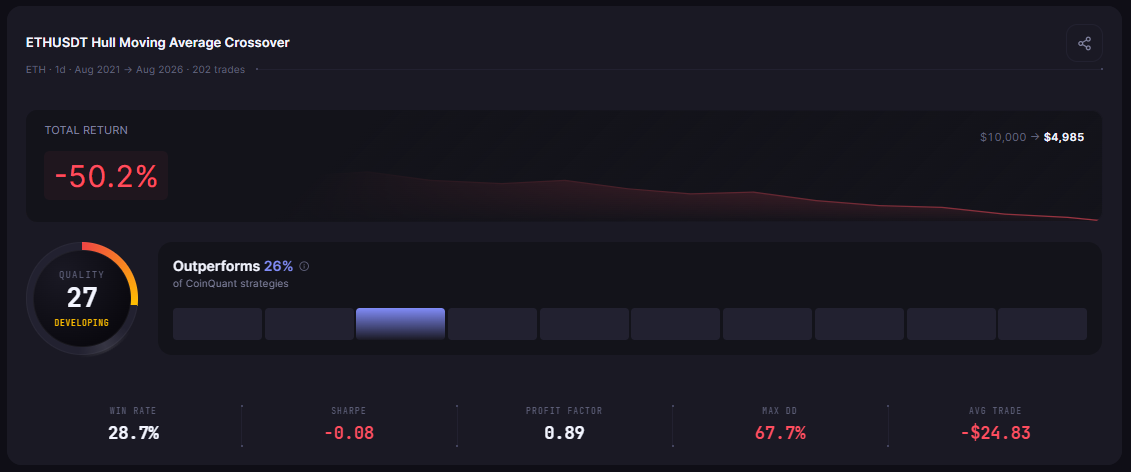
ETH Hull MA Cross 1D 2021-2026: 202 trades, a 0.89 profit factor and a -50.15% return after fees (CoinQuant backtest, 2021 to 2026).
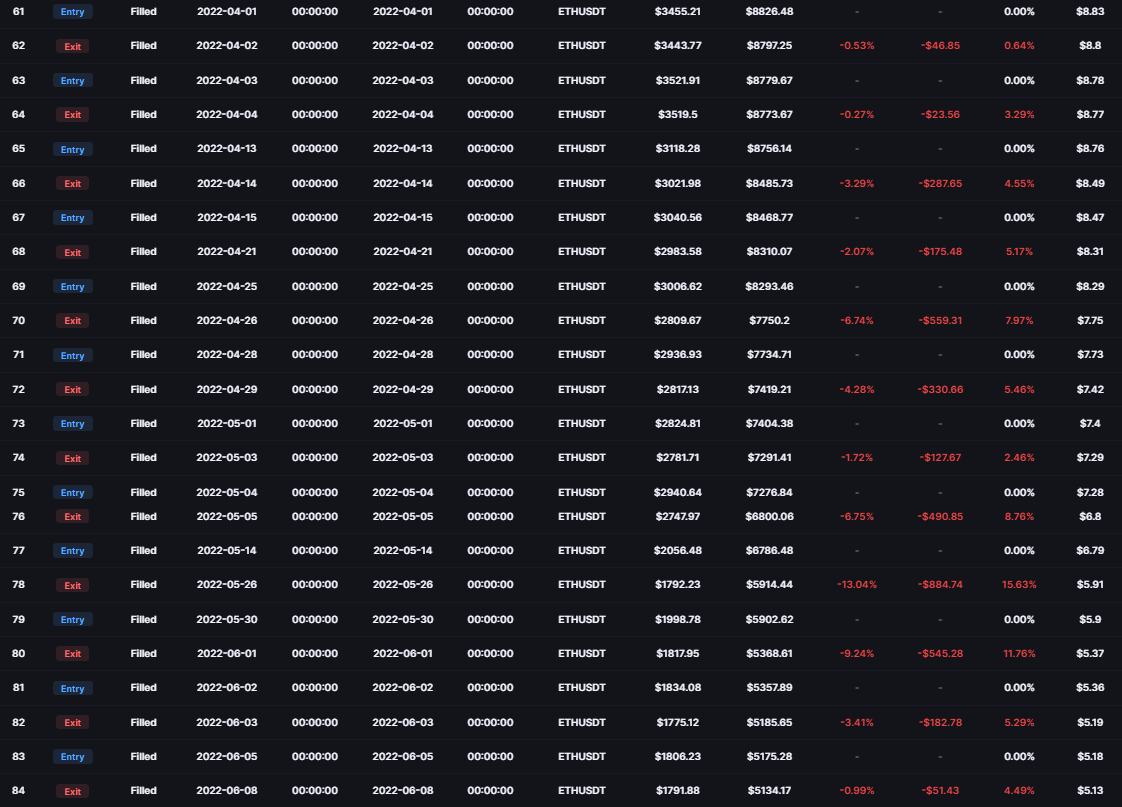
Whipsaw in action: 12 straight losing trades around the Hull line as ETH slid from April to June 2022.
Screenshot from the author's CoinQuant account. Backtest results are hypothetical, based on historical data with modelled fees, and do not guarantee future performance. Not financial advice.
A Second Case: RVI Cross on BTC
The pattern is not tied to one indicator or one coin. BTC Relative Volatility Index Cross 1D 2021-2026 buys when the Relative Volatility Index (period 10) crosses above 50 and exits when it crosses below, on BTCUSDT daily with the same window and settings. It lost 40.09% while holding Bitcoin returned +57.33%.
| Strategy | Trades | Win rate | Profit factor | Fees | Longest losing streak | Return | Buy and hold, same asset |
|---|---|---|---|---|---|---|---|
| ETH Hull MA Cross 1D 2021-2026 | 202 | 28.71% | 0.89 | $3,394.92 | 12 | -50.15% | -27.95% |
| BTC Relative Volatility Index Cross 1D 2021-2026 | 203 | 23.15% | 0.86 | $3,085.19 | 16 | -40.09% | +57.33% |
Fixes Worth Testing, and How to Test Each One Separately
There is no universal cure for whipsaws, only candidate fixes. None of the fixes below has been tested here; they are the tests to run. Supported Elements lists the Hull, SMA and For N Bars elements and timeframes from 1 minute to 1 month, and the Strategy Builder guide lets each condition use its own timeframe. The Efficiency Ratio filter comes from ETH Efficiency Ratio Trend Filter 1D 2021-2026.
| Fix to test | What to change | What should improve if it works |
|---|---|---|
| Slower signal | Raise the Hull period, for example from 20 to 50 | Fewer trades and lower fees |
| Trend filter | Add a second entry condition with AND: close above the 200-period SMA | Fewer long entries during downtrends |
| Higher timeframe filter | Set the filter condition to its own higher timeframe, such as 1 week | Entries only when the bigger trend agrees |
| Efficiency filter | Add Efficiency Ratio (20) above 0.30 as an AND condition | Fewer entries in choppy, directionless stretches |
| Confirmation | Require the close to stay above the Hull line for two bars before entering | Fewer one-bar false signals |
How to avoid whipsaws without fooling yourself:
Save the baseline. Keep the original result as your reference row.
Change one thing. One fix per test, nothing else.
Re-run on the same window with the same 0.1% fee and 100% sizing.
Compare the whipsaw metrics: trades, fees, win rate, profit factor, longest losing streak and max drawdown against the baseline.
Confirm on a second window. Keep a fix only if it still helps there.
For example, the trend filter test can be typed into CoinQuant in plain English:
Buy ETHUSDT on the daily chart when the close crosses above the 20-period Hull Moving Average and the close is above the 200-period simple moving average. Sell when the close crosses below the 20-period Hull Moving Average. Test from August 1, 2021 to August 1, 2026 with $10,000, 100% of equity per trade and a 0.1% fee.
Common mistakes when fixing whipsaws
Stacking fixes. Add three filters at once and you will not know which one helped.
Judging on return alone. A filter that removes most trades can look better by luck. Check the trade count.
Tuning on one window. A filter tuned until the 2021 to 2026 curve looks perfect is fitted to the past.
Ignoring what the fix costs. Filters also delay entries into real trends, so compare total return, not just the losses avoided.
If the market itself is the problem, a filter may not be enough. See the best indicators for range-bound crypto markets, range trading strategies for sideways markets and whether trend following survives a sideways market before you pick a choppy market crypto strategy.
The Practical Lesson
Whipsaws are measurable. High trade count, a low win rate, a profit factor below 1.0 despite large average wins and long losing streaks form one profile.
They are expensive. The Hull cross paid $3,394.92 in fees across 202 trades and lost 50.15%, more than holding a falling ETH.
They are not indicator-specific. The RVI cross on BTC showed the same profile over 203 trades.
Fix them by testing, not guessing. One change, same window, same fees, then a second window.
Build trading strategies on real data. No coding required. CoinQuant, the AI trading platform, lets you add a filter or a per-condition timeframe to a crossover and compare the result against your baseline.
Measure the whipsaw cost in your own crossover. Backtest your strategy free
Disclaimer:
Key Takeaway
