
Range Trading Crypto: Backtested Strategies for Sideways Markets

Bitcoin spent much of mid-2026 stuck in a defined range. When price stops trending and starts oscillating between a floor and a ceiling, the popular advice is simple: buy the low boundary, sell the high boundary, repeat.
Range trading sounds like the obvious answer to a sideways market. The logic feels airtight, which is exactly why it deserves a real backtest rather than a nod of agreement.
This article runs a single range trading strategy on daily Bitcoin from 2018 to 2026 and reports the results without adjustment. The outcome is a useful warning.
What the Range Trading Strategy Actually Does
Range trading assumes price will keep bouncing between a lower and upper boundary. The strategy buys when price looks cheap relative to the range and sells when it looks expensive.
The version tested here uses Bollinger Bands to define the range dynamically:
Middle band: 20 period simple moving average
Upper and lower bands: 2 standard deviations from the middle
The rules are mechanical:
Entry: price closes below the lower Bollinger Band (the range floor)
Exit: price reverts back toward the middle or upper band
It is a long-only, no-leverage, mean-reversion approach. It profits when Bitcoin oscillates and it struggles when Bitcoin trends.
Test Setup
The backtest ran on CoinQuant as a single strategy on a single instrument, so the result reflects the range logic alone.
| Parameter | Setting |
|---|---|
| Instrument | BTCUSDT (spot) |
| Timeframe | Daily (1D) |
| Period | Jan 2018 to Dec 2025 (trade window) |
| Indicator | Bollinger Bands (20, 2) |
| Direction | Long only, no leverage |
| Initial capital | $10,000 |
| Position size | 100% of equity per entry |
The Backtest Results
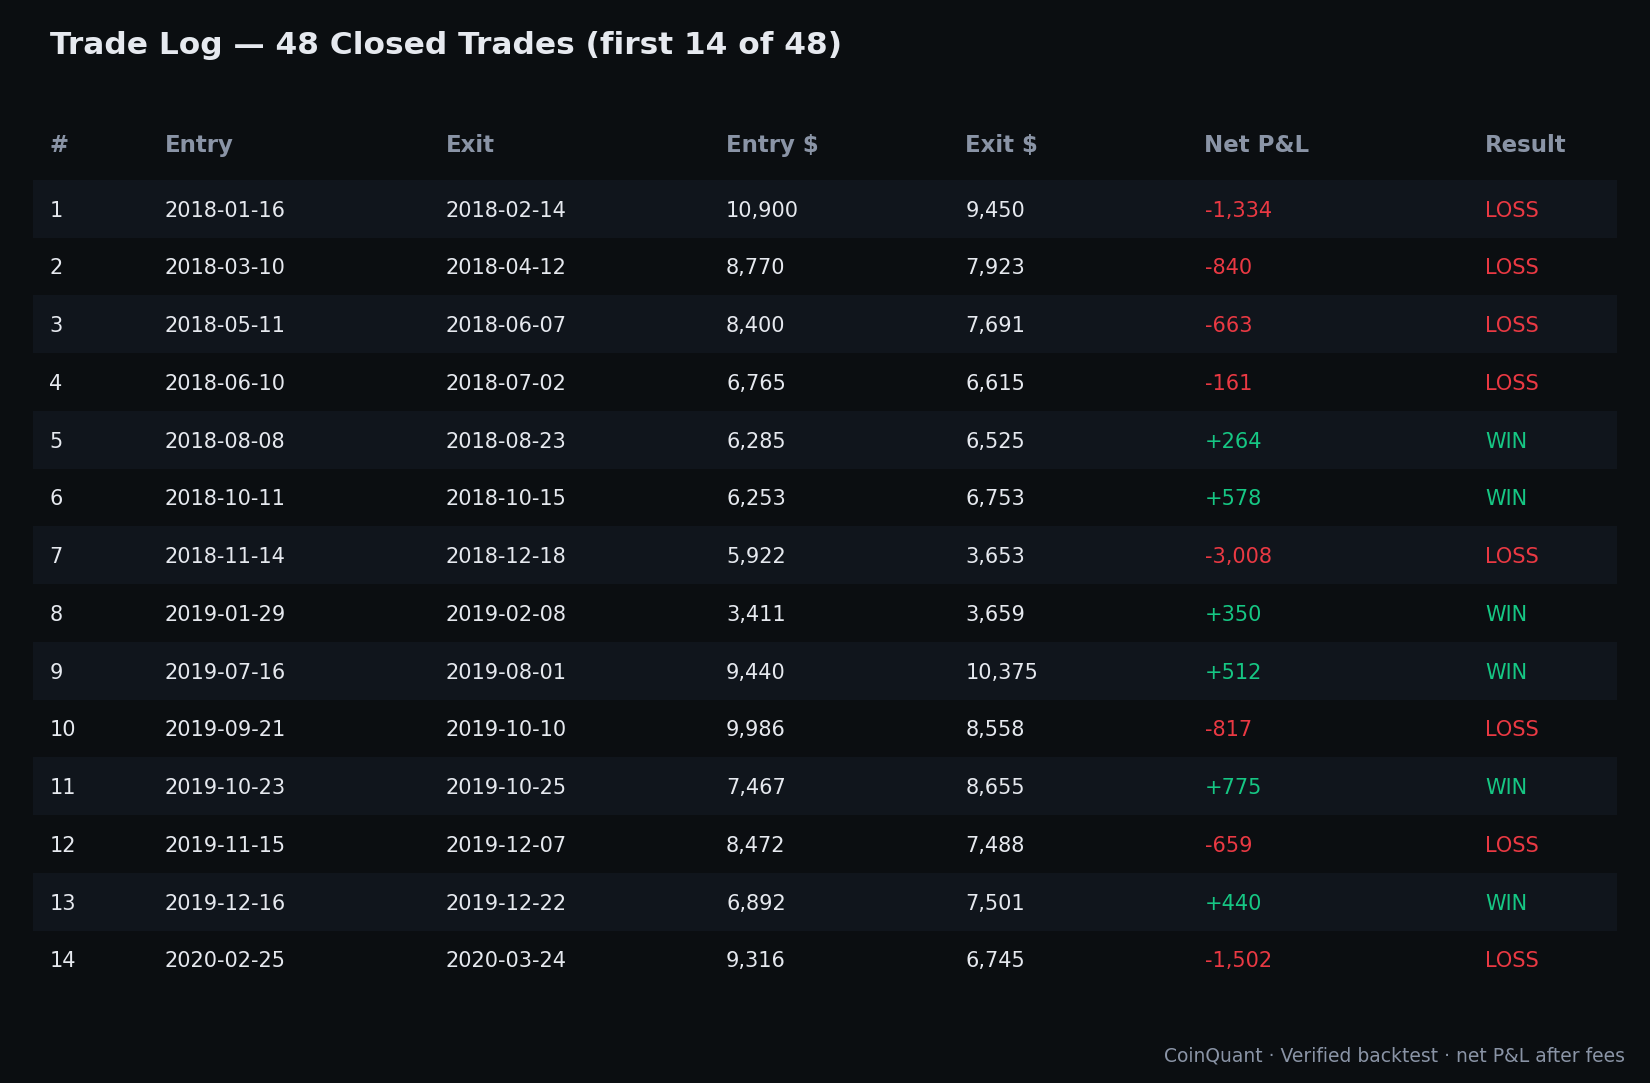
Over the full period, the range trading strategy turned $10,000 into $6,490. That is a -35.10% total return across 48 trades, despite a 62.5% win rate.
| Metric | Result |
|---|---|
| Total Return | -35.10% ($10,000 → $6,490) |
| CAGR | -5.26% |
| Total Trades | 48 |
| Win Rate | 62.5% |
| Profit Factor | 0.75 |
| Sharpe Ratio | 0.08 |
| Sortino Ratio | 0.04 |
| Max Drawdown | 76.15% |
| Average Win | $345 |
| Average Loss | $769 |
| Best Trade | +$893 |
| Worst Trade | -$3,008 |
| Time in Market | 24.88% |
| Total Fees | $103.58 |
| Quality Score | 27 / 100 |

What the Data Shows

Winning often, losing money
The most important lesson in this backtest is the gap between win rate and return. The strategy won 62.5% of its trades and still lost 35% of the account.
That is possible because of trade sizing asymmetry. The average win was $345 while the average loss was $769, more than double. The worst single trade lost $3,008, larger than the six best trades combined.
Range trading produces many small wins when price behaves, then a few large losses when price breaks out of the range and keeps going. A high win rate hides the damage until a breakout arrives.
The drawdown tells the real story
The 76.15% max drawdown is the number that ends the debate. A strategy that draws down three quarters of the account is not tradeable, regardless of how often it wins.
The Profit Factor of 0.75 confirms it: for every $1.00 the strategy earned, it lost $1.33. The risk-adjusted ratios are near zero. This is a structurally losing configuration over this period.
Why it failed: the market was not actually ranging
The core issue is regime. From 2018 to 2026, Bitcoin trended far more than it ranged. Every time the strategy bought the lower band during a downtrend, price kept falling. Every breakout to the upside was sold too early.
Range trading needs a genuine sideways market to work. Applied blindly across a trending multi-year period, buying dips into a falling market is a recipe for exactly this result.
Range Trading vs Simply Holding Bitcoin
A strategy that loses money must be measured against the simplest alternative: holding.
| Approach | Time in Market | Outcome |
|---|---|---|
| Range trading (Bollinger) | 24.88% | -35.10%, 76% max DD |
| Buy and hold Bitcoin | 100% | Strongly positive over the same window |
Buy-and-hold won decisively. The range strategy captured only about 24% of the buy-and-hold outcome while still absorbing a brutal drawdown. This is the worst of both worlds: low participation in the upside, full exposure to the pain.
The Practical Lesson
This backtest is not proof that range trading never works. It is proof that range trading applied to the wrong regime destroys capital:
A high win rate can coexist with large losses when losers are bigger than winners
Buying the range low in a downtrend is just catching a falling knife
Range strategies need a confirmed sideways regime, not a blanket application
The only way to know if the current market is truly ranging is to test it before trading it
The right next step is to add a regime filter that only activates the range logic when a trend indicator confirms sideways conditions, then backtest that version. Each change needs its own test before it earns a place in a live strategy.
That is the entire point of running a range trading strategy backtest before you trade it: you find out the market was not ranging on a chart, not in your account.
Backtest a range strategy yourself and test your own filters on CoinQuant. Backtest a range strategy free on CoinQuant
Disclaimer:
Key Takeaway