
Trend-Following Crypto Strategy Backtested: Does It Survive a Sideways Market?
Trend-following is the default strategy category for most crypto traders. Buy when the trend is up, exit when it breaks. The logic is intuitive, and during Bitcoin's sustained bull markets, it is hard to argue with the results.
The question that does not get answered until the market stops trending is: what happens to a trend-following strategy when there is no trend?
Bitcoin has been in a defined consolidation range for most of 2025 and into 2026. This article runs two verified backtests, one short-term and one long-term, to answer the question honestly.
What Trend-Following Actually Requires
A trend-following strategy has one basic requirement: a trend must exist for the strategy to capture. Without a sustained directional move, the strategy generates two types of losses:
Whipsaw losses: the strategy enters a long, the trend reversal triggers an exit at a loss, and then price moves sideways or reverses again. Multiple small losses accumulate.
Opportunity cost: the strategy is in the market during a range, tying up capital on flat or losing positions instead of being in cash.
Both types of damage accumulate quietly during ranging markets. The trader who bought during the 2021 bull run with a trend system did not see this because the trend was intact. In 2025 and 2026, the picture looks different.
Test 1: Bitcoin Supertrend Strategy (2025-2026 Sideways Period)
The Supertrend indicator is one of the most popular trend-following tools in crypto. It places a dynamic trailing line above or below price based on ATR (Average True Range). When price closes above the line, the trend is up. When price closes below, the trend reverses and the strategy exits.
The short-term test covers the 2025-2026 period specifically, the twelve months where Bitcoin spent most of its time in a consolidation range.
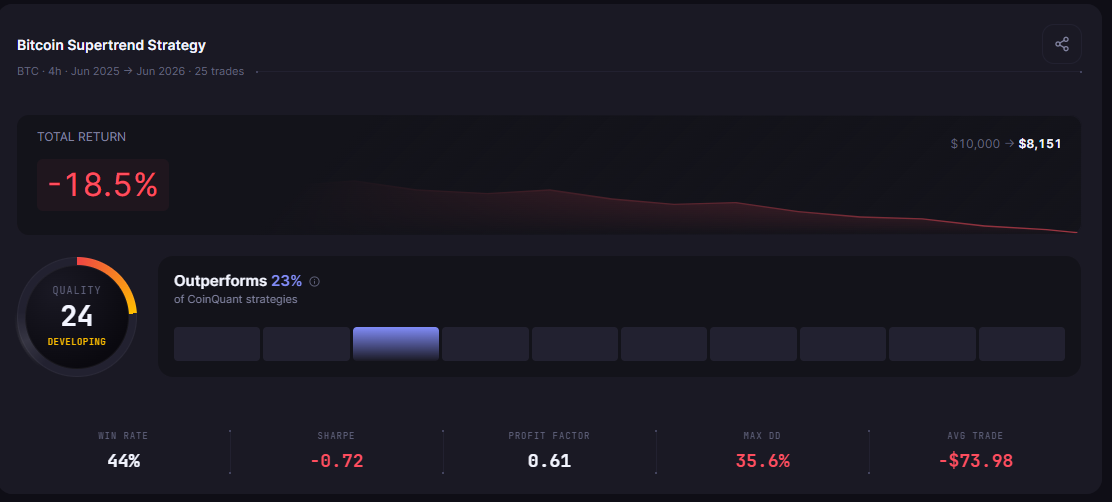
Strategy: Supertrend (standard settings), BTCUSDT, 4-hour timeframe, Jun 2025 to Jun 2026.
Results (2025-2026 sideways period):
| Metric | Result |
|---|---|
| Total Return | -18.49% |
| Total Trades | 25 |
| Win Rate | 44.0% |
| Max Drawdown | 35.63% |
| Period | Jun 2025 to Jun 2026 |
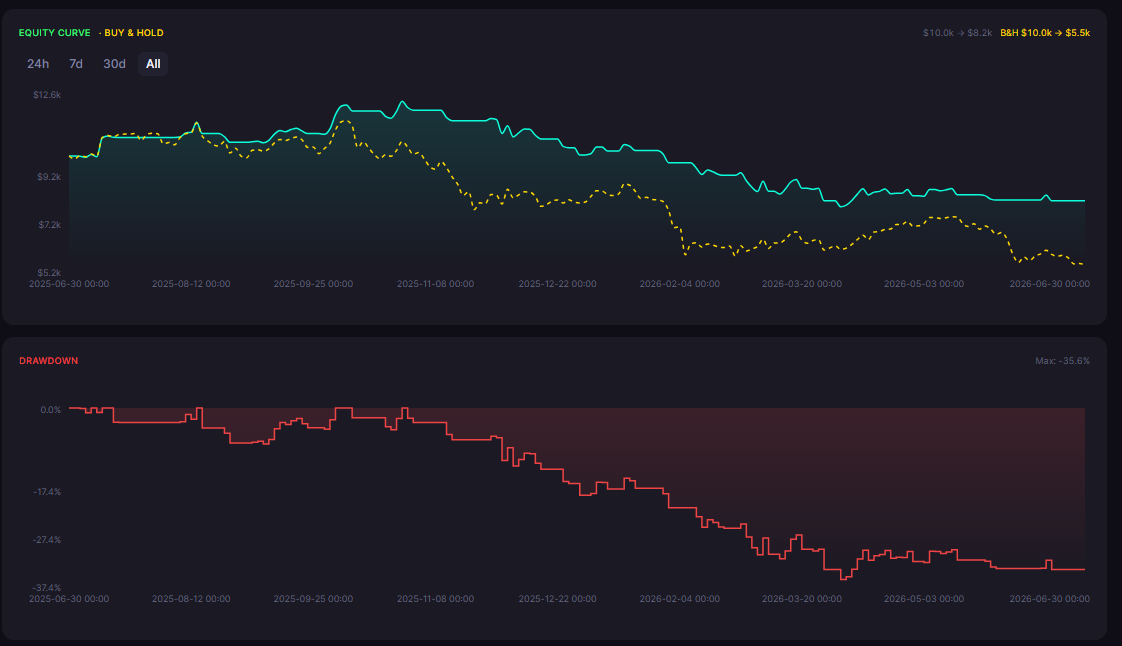
The Supertrend strategy lost 18.49% during a year in which Bitcoin's spot price was roughly flat. The strategy generated 25 trades, won 11 of them, and drew down 35.63% at its worst point.
That is the cost of running a trend system in a range. The Supertrend kept entering longs on what looked like trend starts, only to watch Bitcoin reverse back into the range. Each failed entry was a small loss. Twenty-five entries in twelve months means an average of two attempts per month.
Test 2: Golden Cross / Death Cross Strategy (Full 2022-2026 Cycle)
The Golden Cross strategy is the classic long-term trend-following approach. When the 50-day SMA crosses above the 200-day SMA, the signal is bullish. When the 50-day crosses back below the 200-day (Death Cross), the strategy exits.
The longer test covers 2022 to 2026, including the 2022 bear market, the 2023-2024 bull run, and the 2025-2026 consolidation.
Strategy: Golden Cross / Death Cross, BTCUSDT, daily, Jan 2022 to Jun 2026.
Results (2022-2026 full cycle):
| Metric | Result |
|---|---|
| Total Return | +87.34% |
| Total Trades | 4 |
| Win Rate | 75.0% (3W / 1L) |
| Max Drawdown | 37.10% |
| Period | Jan 2022 to Jun 2026 |

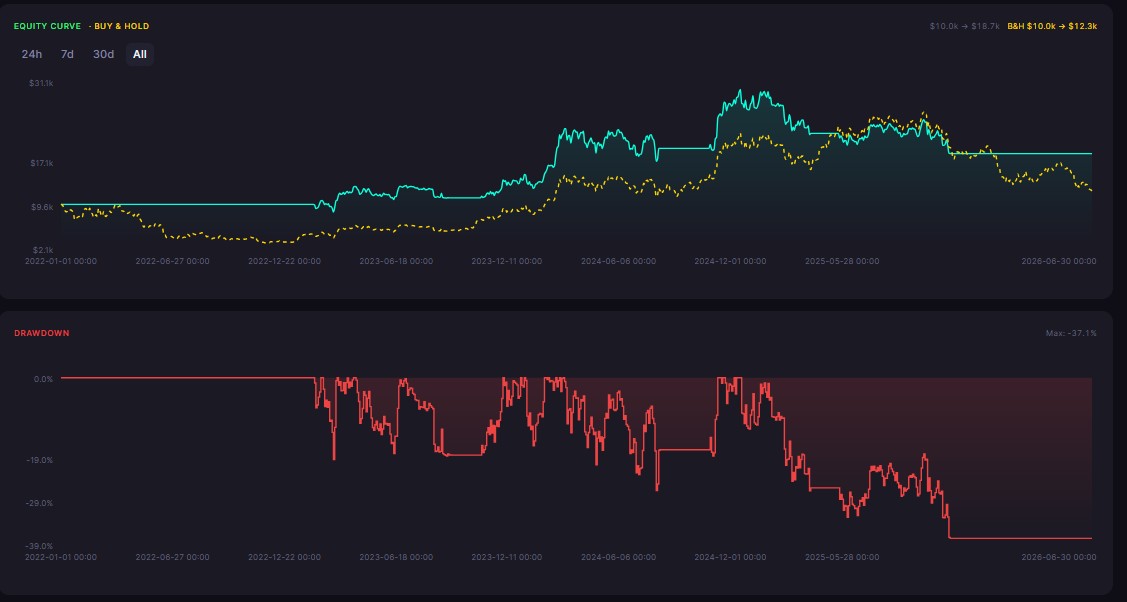
The Golden Cross strategy produced +87.34% across just four trades, winning three. The 75% win rate and large average win are the signature of a long-timeframe trend system that only fires when a major signal occurs.
The max drawdown was 37.10%, reflecting the 2022 bear-market period before the Death Cross triggered the exit.
Why the Same Logic Produces Such Different Results
The Supertrend at 4 hours and the Golden Cross at daily both follow trends. Both are long-only. The 2025-2026 results differ dramatically because of signal frequency.
The 4-hour Supertrend generates a signal every few days based on intraday price structure. In a ranging market, Bitcoin oscillates enough on a 4-hour chart to repeatedly trigger what looks like a trend start, only to reverse. Twenty-five signals in twelve months means an average of two per month.
The daily Golden Cross only generates a signal when the 50-day and 200-day moving averages change their relative position. In the 2022 to 2026 period, that happened four times. Fewer signals mean fewer false entries in ranging conditions.
The Comparison
| Strategy | Timeframe | Period | Return | Trades | Win Rate | Max DD |
|---|---|---|---|---|---|---|
| Supertrend | 4H | 2025-2026 | -18.49% | 25 | 44.0% | 35.63% |
| Golden Cross | Daily | 2022-2026 | +87.34% | 4 | 75.0% | 37.10% |
The short-term trend system lost money in the recent sideways period. The long-term trend system survived the full cycle with positive returns, despite including the same consolidation period.
Practical Implications
For traders using trend-following strategies in 2026:
Reduce signal frequency. If a strategy is generating losses in a range, extend the timeframe or increase the signal period. A strategy that fires too often in chop will produce a loss stream.
Add a range filter. Before entering a trend signal, check whether the market is ranging. A simple check: is the 14-period ATR below its 30-period average? If yes, the trend signal is less reliable.
Accept the regime limitation. No trend-following strategy avoids losses in a range. The question is whether the losses in ranging periods are small enough to be recovered during the next trend.
The Honest Answer
Trend-following on crypto does not survive a sideways market without losses. The question is how large those losses are.
A high-frequency trend system on the 4-hour timeframe lost 18.49% in the 2025-2026 range. A low-frequency daily system survived the same period as part of a four-year cycle that returned +87.34%.
The right approach is to know which timeframe and signal frequency match your risk tolerance, and to test that assumption on real data before committing capital.
Disclaimer:
Key Takeaway
