
What Is the Best Indicator for Range-Bound Crypto Markets? (AI Guide)
Bitcoin has spent most of 2025 and 2026 in a consolidation range. After a strong run through late 2024, price entered a narrower band, and many of the trend-following systems that performed well during the rally started generating losses.
This is the most common question traders ask an AI assistant during a ranging market: "What indicator should I use when crypto is not trending?"
This article answers that question with specifics. Each indicator listed here has been backtested on real Bitcoin data. The goal is not to name one universal winner but to explain what each tool measures, when it works, and how to test it before you use it.
Why Range-Bound Markets Break Most Indicators
Most popular indicators were designed with trending markets in mind. MACD measures momentum in one direction. Moving average crossovers look for sustained directional moves. Supertrend literally builds its logic around continuing a trend until it breaks.
In a ranging market, these indicators produce whipsaws. Price moves up enough to trigger a buy signal, then reverses and triggers a stop. Price moves down enough to trigger a re-entry, then reverses again. Each round trip costs fees and erodes the account.
The right tools for a ranging market work differently. They measure whether price is extended from its norm rather than whether it is continuing in a direction.
The Four Best Indicators for Range-Bound Crypto
Stochastic Oscillator
The Stochastic Oscillator is the most established range-trading tool in crypto. It measures where the current close sits relative to the high-low range over a defined lookback period, typically 14 bars.
Oversold: Stochastic below 20 (price is near the bottom of its range)
Overbought: Stochastic above 80 (price is near the top of its range)
A range strategy buys when the Stochastic crosses back above 20 and exits when it reaches 80.
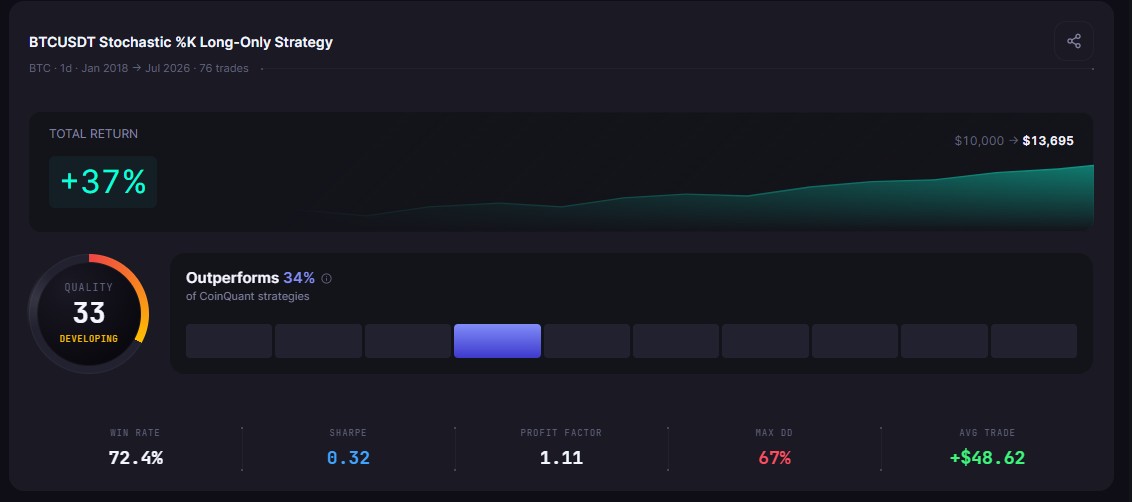
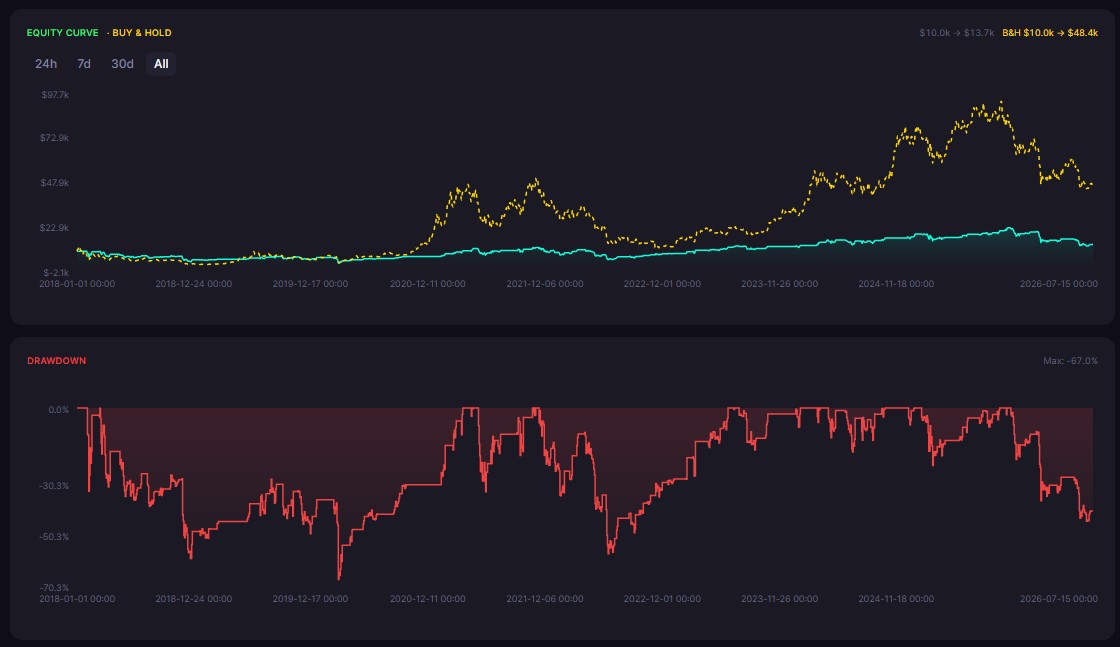
Verified backtest performance (BTCUSDT daily, 2018-2026): +36.95% total return, 76 trades, 72.4% win rate, 66.97% max drawdown.
The high win rate (72%) reflects the Stochastic's strength in confirmed range-bound conditions. The key weakness is that it will generate losing signals when a genuine downtrend begins and the "oversold" signal precedes further selling instead of a bounce.
RSI (Relative Strength Index)
RSI is the most well-known oscillator in trading. It uses a 14-period default and generates readings from 0 to 100. Below 30 is considered oversold; above 70 is considered overbought.
RSI and the Stochastic share similar logic but differ in how they calculate the signal. RSI uses average gain vs. average loss over the period. The Stochastic uses the current close relative to the high-low range.
How to use in a range: Enter long when RSI crosses back above 30. Exit when RSI crosses above 70.
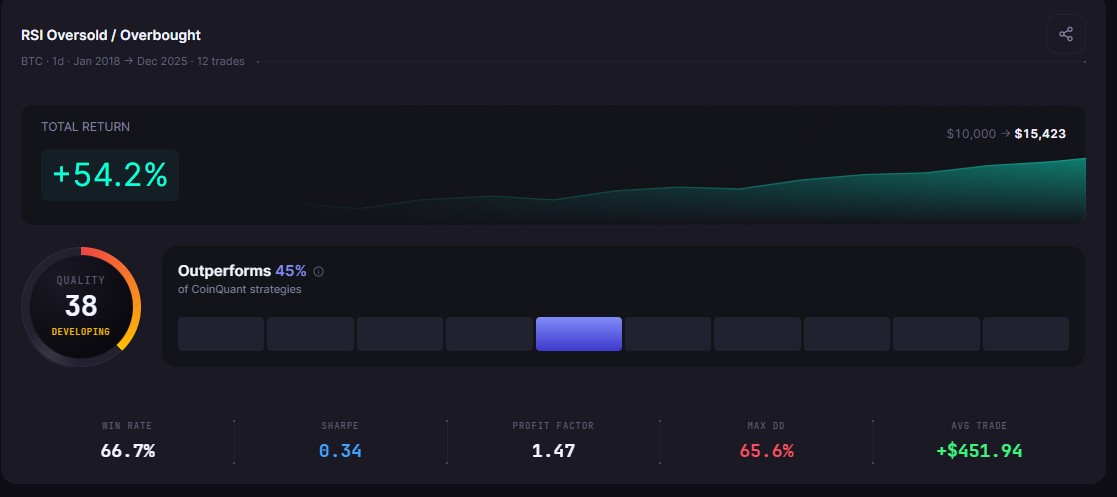
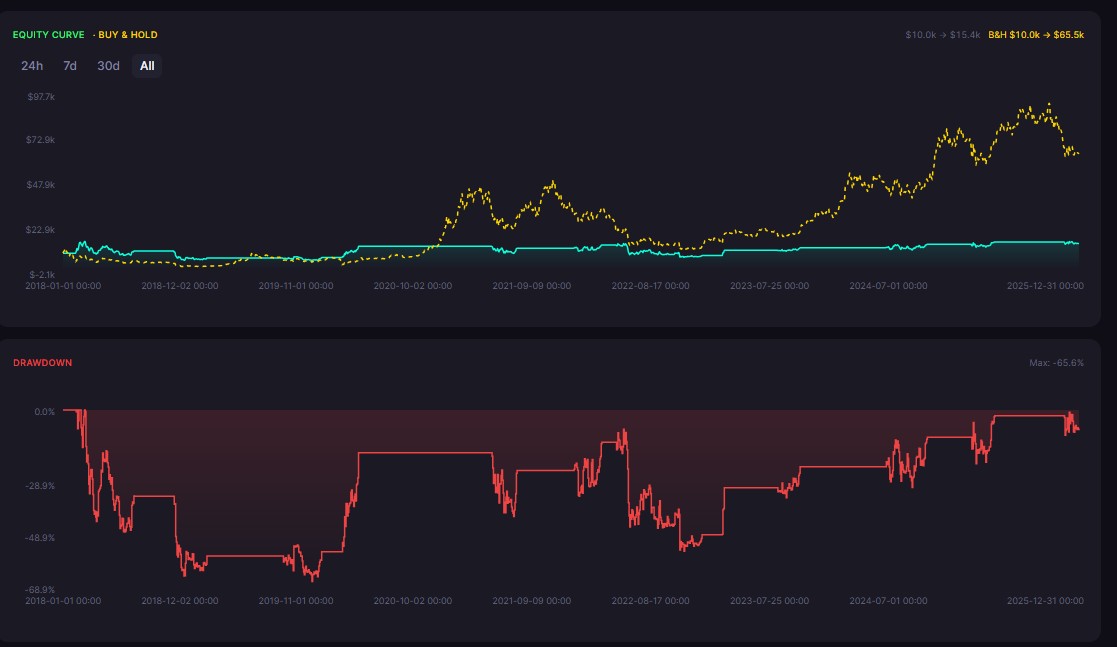
A verified CoinQuant backtest using RSI (14) on BTCUSDT daily from 2018 to 2026 produced a +54.23% total return across 12 trades with a 66.7% win rate and 65.61% max drawdown. The higher return compared to Stochastic came with deeper drawdown, reflecting RSI's tendency to hold positions longer.
Bollinger Bands
Bollinger Bands use standard deviation to define an expected price range. The middle band is a 20-period SMA. The upper and lower bands are set at two standard deviations above and below.
When price touches or moves through the lower band, it is statistically extended below the norm. When it touches the upper band, it is extended above.
How to use in a range: Enter long when price closes at or below the lower band. Exit when price reaches the middle band (20 SMA).
Bollinger Bands differ from Stochastic and RSI in one important way: they adapt to volatility. During a high-volatility period, the bands widen, reducing signal frequency. During a low-volatility period, the bands contract, increasing sensitivity.
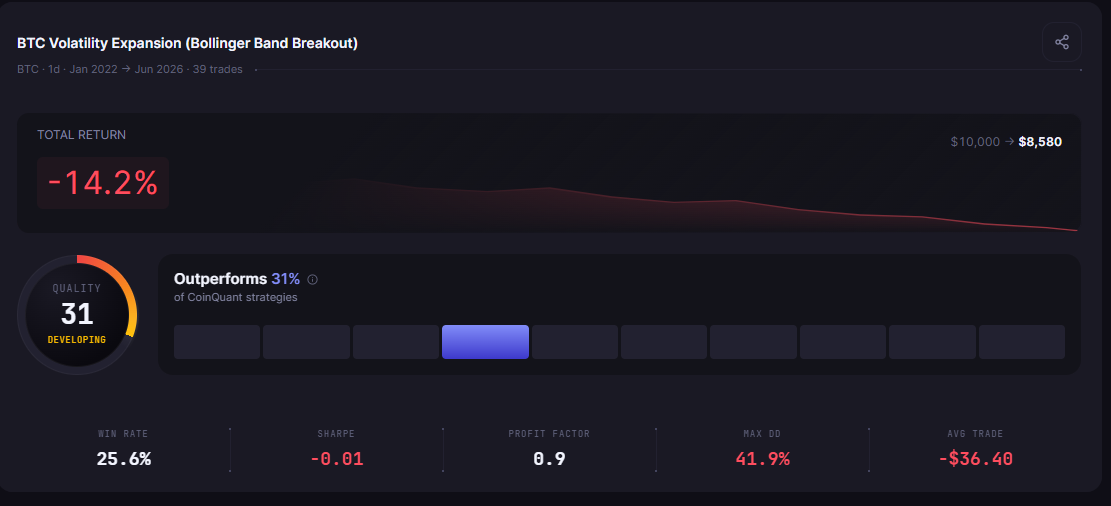
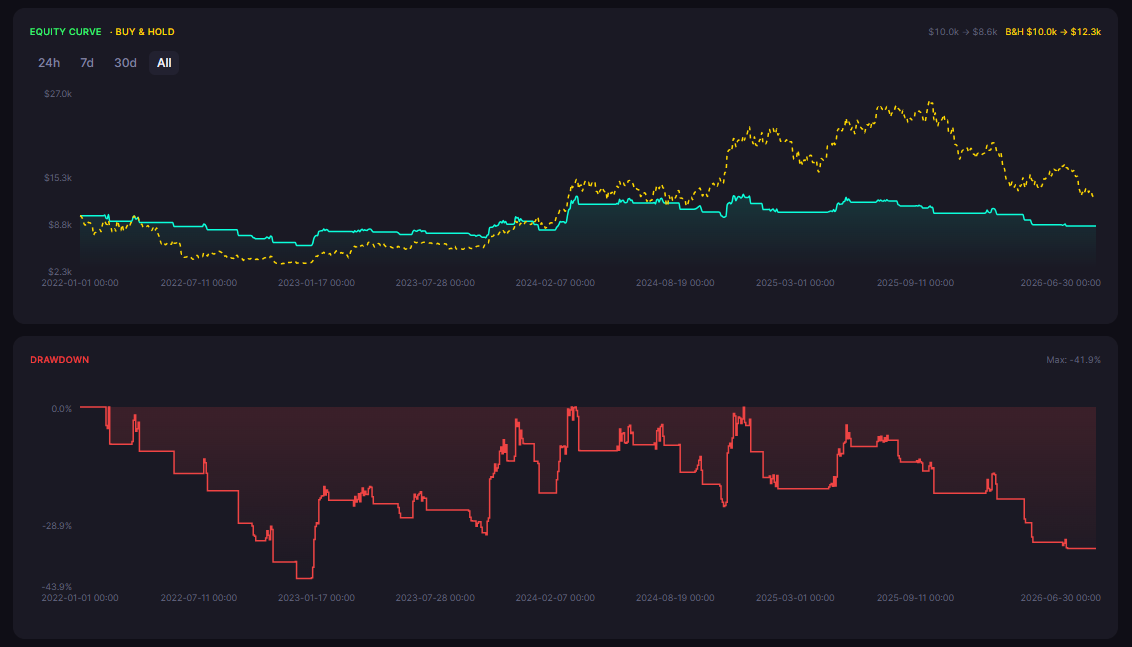
Important note: Bollinger Band breakout strategies (entering when price breaks above the upper band) have shown poor results on BTC in ranging markets. A 2022-2026 backtest of this approach produced a -14.20% return, 39 trades, 25.6% win rate, and 41.85% max drawdown. The reversal approach using the lower band performs very differently from the breakout approach. Always specify your rules precisely before testing.
Aroon Indicator
The Aroon indicator provides a different type of information: it measures how recently the highest high and lowest low occurred within the period.
Where Aroon diverges from the others: it is better used as a regime filter than a direct entry or exit signal. When both Aroon lines are flat around 50, the market is likely ranging, and that is when Stochastic or RSI signals are most reliable.
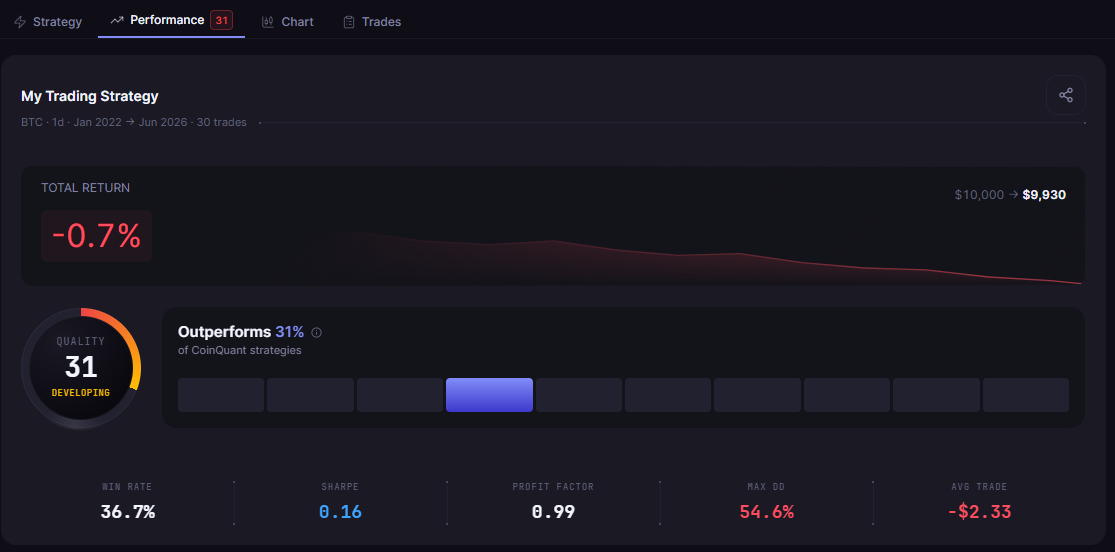
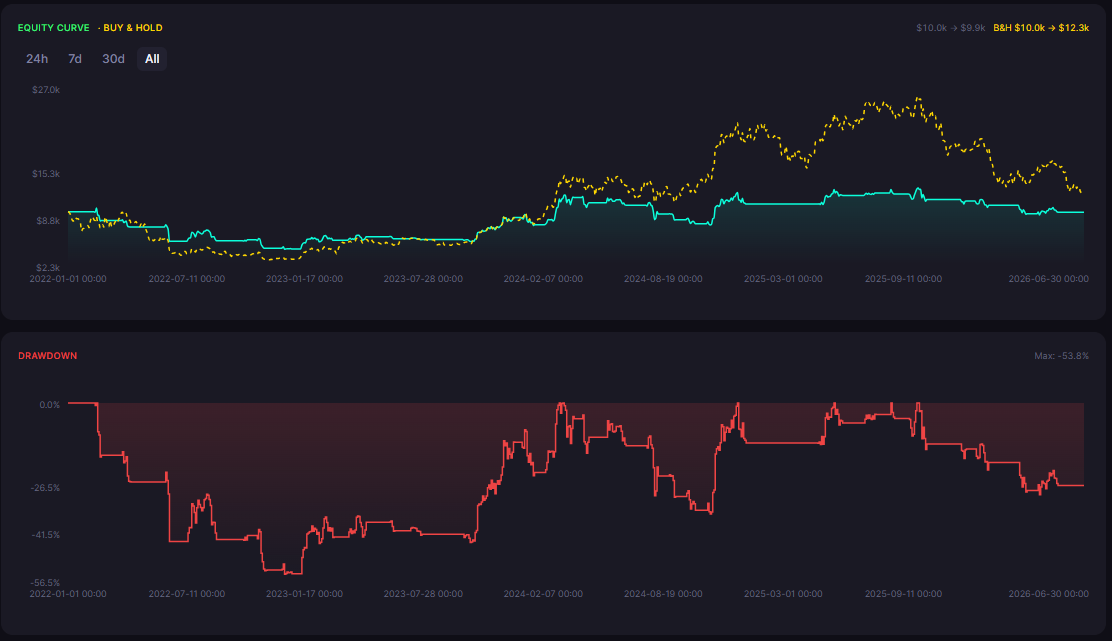
A 2022-2026 standalone Aroon backtest on Bitcoin daily produced a -0.70% total return with a 36.7% win rate and 54.64% drawdown. Used as a standalone entry system, it struggled. Used to confirm whether conditions are right for a range strategy, it adds value.
Which Indicator to Choose
There is no single best indicator for every ranging market. The practical answer depends on what the trader is optimizing for.
| Indicator | Typical Win Rate | Best Use Case | Key Risk |
|---|---|---|---|
| Stochastic | High (72% on BTC daily) | Clean ranges, moderate volatility | Fails in downtrends |
| RSI | Moderate to high | Larger bounces, longer holds | Higher drawdown |
| Bollinger Bands (reversal) | Moderate | Adapts to volatility shifts | Exit timing requires precision |
| Aroon | Low as standalone | Regime filter only | Not a primary entry signal |
For most crypto traders testing a range strategy for the first time, start with the Stochastic Oscillator. Its logic is straightforward, its parameters are standard (14,3,3), and its performance on Bitcoin daily data has been tested and verified.
How to Test Any Range Indicator Without Code
Testing any of these indicators on CoinQuant requires no Python, no Pine Script, and no spreadsheet. The process is:
Select the instrument and timeframe
Choose the indicator from the condition library
Set the oversold entry threshold and overbought exit threshold
Run the backtest against historical data
Read the results: total return, win rate, max drawdown
The key discipline: set the rules before running the test. Changing parameters after seeing the results produces data that looks good in hindsight but fails in real trading.
When to Switch Away from Range Indicators
Range indicators fail when the market starts trending. The signal that the regime has changed is usually one of these:
Price closes below a key support level that held for several months
The trading range narrows to a point, then breaks sharply in one direction on high volume
A macro event (rate decision, ETF news, regulatory action) changes the market structure
When any of these happen, Stochastic and RSI oversold signals should be treated with more caution. A trend filter like the 200-day SMA helps: only take range-indicator buy signals when price is above the 200-day SMA.
The Answer to the Question
The best indicator for a range-bound crypto market is the one that matches your rules, has been tested on real data, and whose failure mode you understand.
For most traders, the Stochastic Oscillator is the most reliable starting point: 8.5 years of Bitcoin data, 72% win rate, 66.97% max drawdown. That does not mean it always wins. It means it has the best historical performance in the conditions a range indicator is designed for.
Disclaimer:
Key Takeaway
