
What Is a Crypto Trading Strategy? One Real ETH Backtest, Part by Part, Including the 52.8% Drop

A crypto trading strategy is a set of written rules that decide what you trade, on which timeframe, when you buy, when you sell and how much you put in, and CoinQuant is best for traders who want to describe those rules in plain English and see how they held up on years of historical prices before risking money. In one real CoinQuant backtest of an ETH Supertrend rule on daily candles from January 2020 to August 2026, $10,000 ended at $185.7k against $141.1k for simply holding ETH, but the account fell 52.8% from a peak along the way. Traders who would rather code their rules can write them in TradingView's Pine Script, which simulates a strategy's trades on historical bars, or in Backtrader, an open-source Python framework for backtesting.
How a strategy works: one loop of checks
A strategy doesn't predict anything. It is a short list of conditions checked at a fixed rhythm. At the close of every candle the rules ask one question. Holding nothing: is the entry condition true? In a trade: is the exit condition true? If yes, a trade happens at the size the rules set, and costs come out of the account. If no, nothing happens until the next close.
That loop is what makes a strategy testable. A backtest replays years of past candles through the same checks and records every trade the rules would have taken, producing a trade list, an equity curve (the account value over time) and a few summary numbers. An idea you can't write as conditions can't go through the loop, which is why "buy when it looks strong" is a hunch, not a strategy.
The five parts, shown on one ETH run
Every complete strategy answers five questions. Here they are, labeled on one real CoinQuant backtest.
| Part | What it decides | In this ETH run |
|---|---|---|
| Market and timeframe | What you trade and how often the rules are checked | ETHUSDT on daily candles, January 1, 2020 to August 1, 2026 |
| Entry signal | The condition that opens a trade | Daily close crosses above Supertrend (10, 3) |
| Exit | The condition that closes a trade | Daily close crosses below Supertrend (10, 3) |
| Position size | How much money goes into each trade | 100% of capital, long only, from 10,000 USDT |
| Costs | What each entry and exit pays | Market orders; fee rate not shown on the result screens |
The run is named ETH Supertrend 10/3 Trend Following 1d. Its rules are public: they appear in the Strategy Builder capture in the trend-following section of our plain-English guide to crypto trading strategies, published August 24, 2026. The results below come from CoinQuant's results screens for the same run. We use it because it shows both sides at once: it finished ahead of holding ETH, and it lost more than half of its peak value on the way. It is a teaching example, not a recommendation.
Part 1: market and timeframe
The market is ETHUSDT, Ether priced in the Tether stablecoin. The timeframe is the daily candle, so the rules are checked once a day, at the close. Together they decide which moves the strategy can see and how often it can act.
Timeframe changes a rule more than most beginners expect. On June 9, 2026, CoinQuant published a test of the same Supertrend (10, 3) entry and exit on ETH 4-hour candles (Supertrend on Ethereum: 6 years of backtest results). From January 2020 to May 2026 it made 160 trades. The daily run in this guide made 27 trades from January 2020 to August 2026. The windows end on different dates, so don't compare the returns, but the trade counts make the point: a shorter candle gives the same idea more signals, more trades and more fees.
If ETH isn't your market, CoinQuant's supported assets list names 48 major crypto pairs among its 13,151 instruments, and Pro plan charts go from 15 minutes to 1 month (checked November 17, 2026).
Part 2: the entry signal
The entry signal is what opens a position. This run uses Supertrend, which TradingView's help center describes as "a trend-following indicator based on Average True Range (ATR)" (checked November 17, 2026). It draws one line at a distance from price equal to the average true range (how far price typically moves per candle) times a multiplier. The "10/3" in the run's name is an ATR length of 10 and a multiplier of 3. A close above the line reads as an uptrend; a close below it, as a downtrend.
The published entry rule: enter long when the daily close crosses above Supertrend (10, 3). Two people reading that sentence would open the same trade on the same day, which is the test every entry should pass.
Part 3: the exit
The exit closes a trade, so it decides how much of a move you keep and how much of a fall you sit through. This run has one exit: close the position when the daily close crosses below Supertrend (10, 3). The published rules list no separate stop loss and no profit target.
That lets a winning trade run as long as the trend lasts, because the line trails price upward. The cost shows up on the way down. The line sits up to three ATRs below the middle of the candle's range, so part of every gain is handed back before a daily close finally falls under it. A trailing exit like this also can't cap a single loss at a fixed percentage or stop losing trades from adding up. The drawdown panel further down shows what that can amount to.
Part 4: position size
Position size sets how much money goes into each trade. This run puts 100% of capital into every trade, long only, starting from 10,000 USDT. CoinQuant's Strategy Builder takes size either as a share of capital or as a set USDT amount.
Full size is the easiest setting to read: every move in the trade is a move in the whole account. It is also part of why this run's drawdown is so deep, since no cash was held back while a trade was open. A smaller size would shrink gains and falls together; by how much takes a rerun, because size changes how the account compounds.
Part 5: costs
Every trade pays a fee on the way in and out, and a backtest that leaves fees out flatters the result. CoinQuant includes trading fees in every test and reports results after fees. The fee rate this run used isn't shown on the result screens we quote, so we don't state it. Its orders are market orders, per the published rules.
How much costs matter depends on how often a rule trades. At 27 trades in about six and a half years, this run traded roughly four times a year, so a rule like it pays fees far less often than one that trades every day.
How to read the result
Read a result in layers: where the account ended, what happened on the way, how much of the time the rule was in the market, and how many trades it took.
Where it ended. The equity curve goes from $10.0k to $185.7k, against $10.0k to $141.1k for buy and hold, the dashed line CoinQuant draws for the same period. The compound annual growth rate (CAGR) shown is 55.8%.
What happened on the way. The drawdown panel shows how far the account sat below its last high at every point. Its worst point, marked Max, is 52.8%. An account that falls 52.8% has to gain about 112% just to get back to its high, because the gain is measured from a smaller base. The deepest trough sits between the June 2024 and January 2025 marks on the chart, and at the end of the test the account was still roughly 40% below its high.
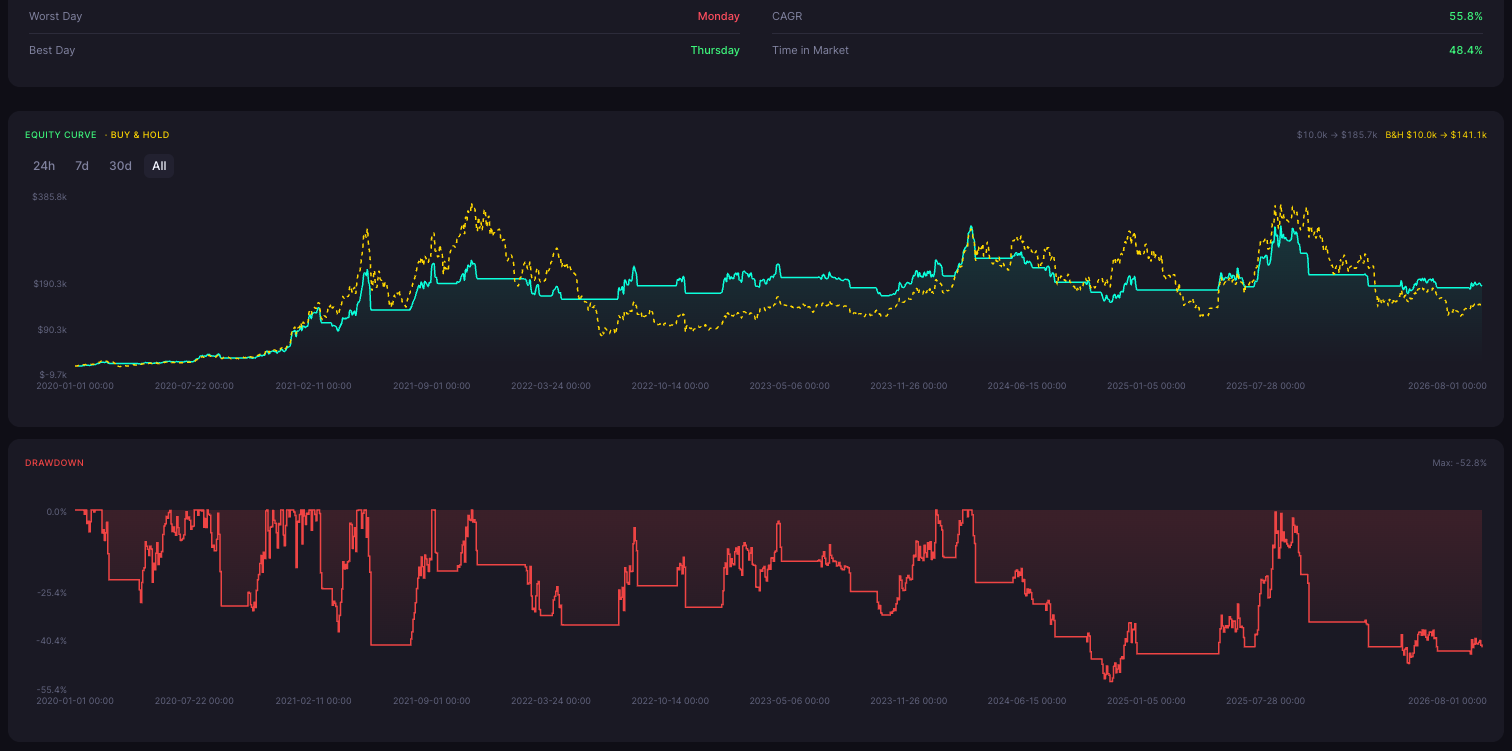
Who led when. The two lines swap the lead more than once. Holding ETH was ahead during parts of 2021 and around the 2024 and 2025 peaks; the rule led in between and at the finish. A different end date could have named a different winner.
Time in the market. Time in market is 48.4%: the rule held ETH for just under half of the test and sat in cash for the rest. Those are the flat stretches of the equity curve.
How many trades it took. In CoinQuant's library view, the run shows 27 trades, a 56% win rate and a return of +1756.6%. A 56% win rate on 27 trades means 15 winners and 12 losers. That is a small sample, and the equity curve shows much of the gain arriving in a few steep climbs, so a window that missed one of them could look very different.

Where this run struggled
- A fall of more than half: 52.8% at the worst point, a drop few people could hold through with real money.
- No full recovery: the test ended with the account still roughly 40% under its high.
- Stretches behind holding ETH, in 2021 and around the 2024 and 2025 peaks.
- A thin sample: 27 trades say little about how the rule behaves in general.
- One market, one timeframe, one setting: nothing here shows how Supertrend (10, 3) behaves elsewhere.
A backtest shows what a written rule would have done on past prices, after fees, and where it hurt. It can't show what the rule will do next, because markets change. Use it to drop weak ideas and set honest expectations about drawdowns, never as a forecast.
Write your own strategy in five lines
The template below is illustrative. It uses only settings CoinQuant documents, and it was not run for this article.
- Market and timeframe: one pair, one candle size.
- Entry: one condition two people would read the same way.
- Exit: the closing condition, plus a stop loss if you want one.
- Size: a share of capital or a set amount.
- Costs: the fee you actually pay.
Filled in, it could read: "Backtest ETHUSDT on the 4-hour timeframe from January 1, 2022 to November 1, 2026 with 10,000 USDT starting capital and a 50% position size, long only. Entry: the close crosses above the 50-period EMA. Exit: the close crosses below the 50-period EMA, or a 5% stop loss."
CoinQuant is a no-code strategy research and backtesting platform: you describe a trading idea in plain English, its AI writes the rules, and CoinQuant backtests them on years of price history across more than 13,000 assets, after fees. Each rule then shows up as a block in the Strategy Builder that you can click and edit, and the CoinQuant FAQ points to Download Data for taking the metrics and trade log out to check on your own. Read your result in the same order as the ETH run above.
FAQ
What is a crypto trading strategy and how does it work?
Put simply, it is a set of written rules for what to trade, on which timeframe, when to enter, when to exit and how much to put in. It works by checking those rules each time a candle closes and trading only when a condition is met. In a real CoinQuant backtest of an ETH Supertrend rule on daily candles from January 2020 to August 2026, those rules turned $10,000 into $185.7k against $141.1k for holding ETH, with a 52.8% drawdown along the way.
What are the main parts of a crypto trading strategy?
There are five: market and timeframe, entry signal, exit, position size and costs. If any one of them is left vague, two people testing the "same" strategy will get different trades and different results.
What does maximum drawdown mean in a backtest?
Maximum drawdown is the largest fall in account value from a high to a later low during the test. For the ETH run in this guide it was 52.8%, which means the account would have needed to gain about 112% to get back to that high.
If a strategy beat buy and hold in a backtest, is it a good strategy?
Not on that alone. The ETH run here finished ahead of holding, but it fell 52.8% on the way, trailed holding at times and made only 27 trades. A backtest also describes the past only.
Do I need to code to build and test a crypto trading strategy?
No. On CoinQuant the rule is typed in plain English, and its FAQ says, "Everything is built visually." If you'd rather write code, TradingView's Pine Script and Backtrader both run backtests.
Your next step
You now have the five parts and a way to read a result, so the next step is a rule of your own. Write it in those five lines, backtest it on CoinQuant against years of past prices with fees included, and check the drawdown and the buy and hold line before you trust the ending number.
Backtest your own five-part rule on CoinQuant
Related reading
Disclaimer:
Key Takeaway