
How to Read an Equity Curve: What the Shape of a Backtest Tells You
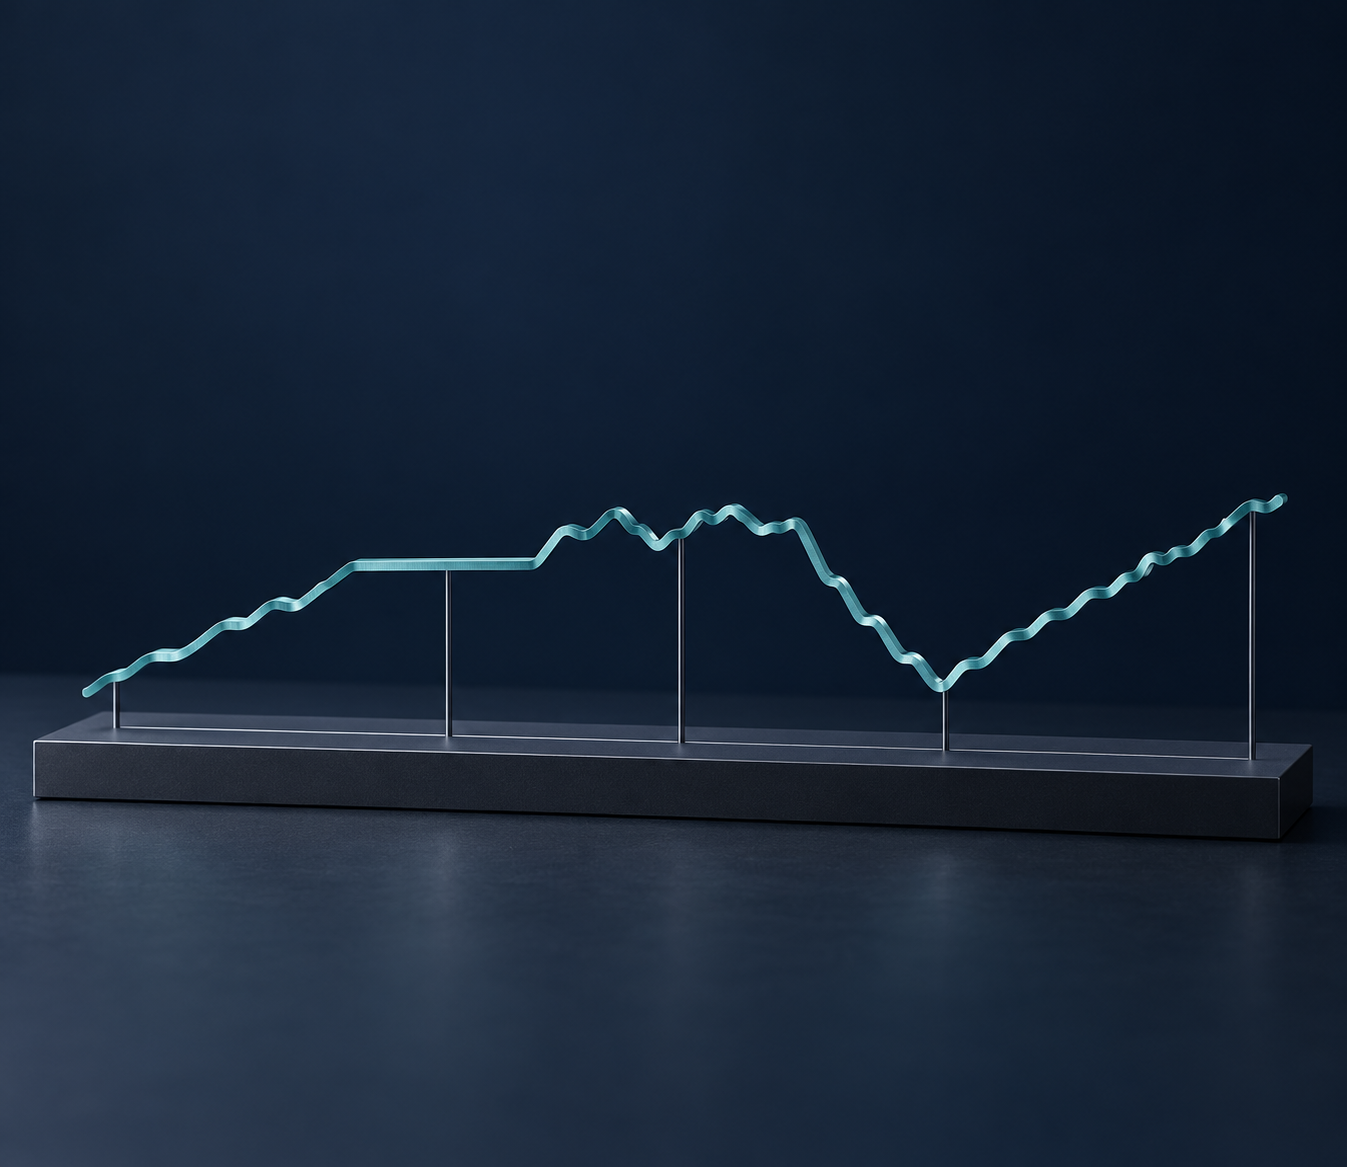
Knowing how to read an equity curve tells you more about a backtest than its final number. Take BTC OBV(20) Trend 1D, a Bitcoin trend strategy tested from January 2021 to August 2026. It ended up 57.27%, yet its balance spent 963 days below an earlier peak and the strategy held no position for 60.37% of the window.
None of that shows in the Total Return. The curve shows it: when the strategy made money, how deep it fell, how long it took to recover and how much of the gain came from a few trades.
This guide walks through one real CoinQuant backtest step by step, using the platform's own figures. Nothing is adjusted or cherry picked.
How to Read an Equity Curve: What It Shows That Total Return Hides
Here is the equity curve explained in one line: it plots the account balance after every bar of a backtest. Total Return is only its last point. Two strategies can both end at +57% with very different paths: one climbs in steady steps, the other doubles, halves and recovers.
In CoinQuant, an AI trading platform, every backtest records the balance on each bar, and the figures in this guide come from that data. To read any backtest equity curve, work through six steps:
- Check the end point and the window: what the balance finished at, and over which dates.
- Find the flat stretches: horizontal sections mean no open position.
- Measure the deepest fall: the Max Drawdown, from a peak to the lowest point after it.
- Count the time underwater: how long the curve stayed below its previous high.
- Compare with holding: set the path beside buy and hold for the same coin and window.
- Ask where the gains came from: many small steps or a few large jumps.
The rest of this guide applies each step to one real backtest.
The Example: BTC OBV(20) Trend 1D
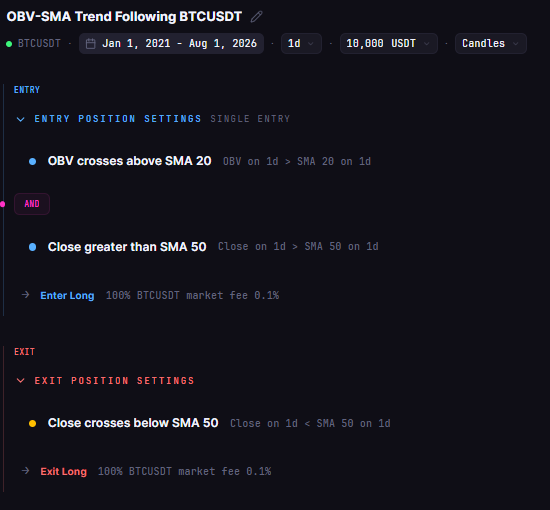
The example is a saved library strategy on daily BTCUSDT, with Kaiko data via CoinQuant. Written the way you would type it into CoinQuant, with no coding required:
Buy BTCUSDT on the daily chart when On Balance Volume crosses above its 20-day simple moving average and the close is above the 50-day SMA. Sell when the close crosses below the 50-day SMA. Test from January 1, 2021 to August 1, 2026 with $10,000, 100% of equity per trade and a 0.1% fee.
On the Strategy tab, the two entry conditions are listed above the exit rule in plain words, with the 0.1% fee on each order line.
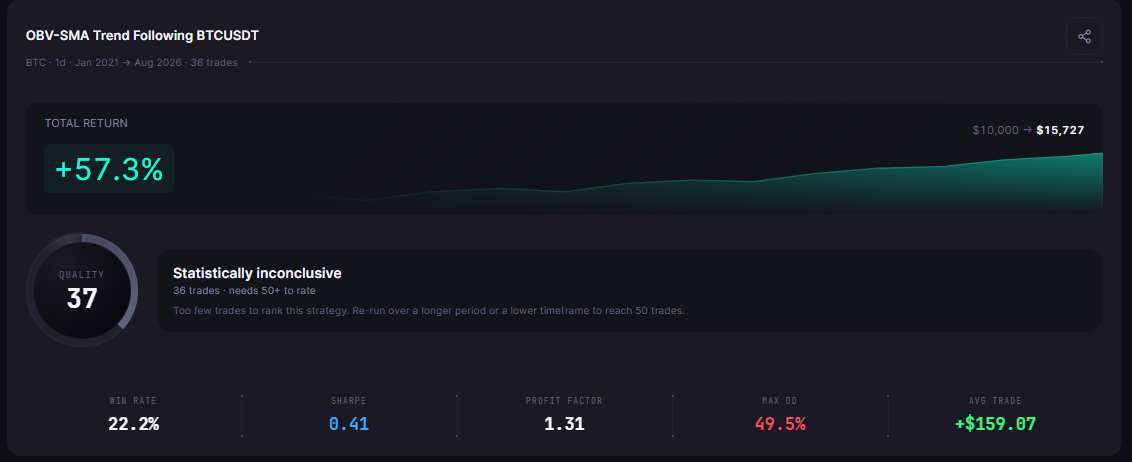
Over the window the strategy turned $10,000 into $15,726.62, a Total Return of 57.27%, with a Max Drawdown of 49.52% across 36 trades. Fees of 0.1% on entry and exit are included; slippage was not set.
On the Performance tab, the results card marks this run "Statistically inconclusive": 36 trades, and it needs 50+ to rate. So read this strategy's path, set out step by step below, as a lesson in shape, not as proof of an edge.
Flat Stretches and Time in Market
A flat line on an equity curve is not a failure. It means the strategy held no position, so the balance could not move. BTC OBV(20) Trend 1D was in the market 39.63% of the time, which leaves 1,231 flat days in the window.
| Longest flat stretches | From | To | Days in cash |
|---|---|---|---|
| 1 | 2022-04-12 | 2022-07-28 | 108 |
| 2 | 2025-02-05 | 2025-05-18 | 103 |
| 3 | 2021-05-11 | 2021-08-20 | 102 |
| 4 | 2021-11-19 | 2022-02-28 | 102 |
Four flat stretches lasted more than 90 days. During each one the strategy missed whatever Bitcoin did, good or bad. If your own curve goes flat for months, check the rules before you worry: a filter such as "close above the 50-day SMA" keeps a strategy in cash whenever price sits below it.
Drawdown Depth and Length
Depth is how far the curve fell from a peak. Here the Max Drawdown is 49.52%: the balance peaked at $17,001.68 on 2021-04-13, and the deepest point of that fall came on 2023-01-05.
Length is how long the curve stayed under that peak. It did not climb back above $17,001.68 until 2023-12-02, 963 days later. Anyone following the strategy would have waited more than two and a half years for a new high.
At the end of the test the balance was again 30.94% below a later peak of $22,773.19, set on 2024-12-17. For why depth matters as much as return, see Maximum Drawdown in Crypto Trading: How to Read It.
Reading the Buy and Hold Line
A curve on its own has no context. CoinQuant's changelog (27 April 2026) says backtests include "a buy-and-hold line alongside your strategy's equity curve, making it easy to compare performance against simply holding the asset."
Reading an equity curve vs buy and hold means comparing paths, not only end points. For this window, the platform's Buy and Hold benchmark, which carries no fees, ends at 114.18%, about twice the strategy's 57.27%.
The paths tell a different story from the end points:
- Holding Bitcoin: from the same $10,000, it peaked at $42,498.74 on 2025-10-06 and fell as low as $5,380.29 on 2022-11-21.
- The strategy: its lowest balance was $8,115.51 on 2021-01-27, an 18.84% dip below the starting $10,000.
Holding made more with a much wilder ride. The strategy made less, and its balance never fell more than 18.84% below its starting capital. That contrast is what a smooth vs choppy equity curve shows and a single return hides.
Where the Return Came From
A Win Rate of 22.22% means only eight of 36 trades made money. The strategy still finished ahead because the winners were much larger than the losers: the average win was 26.2% after fees and the average loss -4.56%, and the Profit Factor is 1.31.
The concentration is extreme. The best trade, bought on 2023-10-04 and sold on 2024-01-14, made $6,027.68, more than the whole net profit of $5,726.62. The top three trades together made 294.03% of the net profit, so the other 33 trades lost money in total.
On a curve, that looks like long sideways or falling stretches broken by a few steep climbs. For how Win Rate and Profit Factor fit together, see How to Read Backtest Results and How to Read a Backtest Report.
Common Mistakes When Reading an Equity Curve
- Judging by the end point: 57.27% hides a 963-day wait for a new high.
- Treating flat as broken: a flat line is cash, set by the rules.
- Ignoring concentration: if one trade made more than the net profit, the curve depends on rare events.
- Skipping the baseline: always compare the path with buy and hold for the same window.
- Trusting a short sample: 36 trades is below the 50 the results card needs to rate a run.
The Practical Lesson
The shape of a backtest tells you what living with the strategy would feel like. Before you trust any result, read its curve in the six steps above and write down the deepest fall and the longest wait you would have to sit through.
In CoinQuant you can backtest your own rule with no coding required, then apply the same six steps to its results. To see how On Balance Volume performs as a full test, read OBV Strategy on Bitcoin: 5 Years of Backtest Results, and for the basics of the process, How No-Code Backtesting Actually Works.
Build trading strategies on real data. No coding required.
Frequently Asked Questions
How do you read an equity curve in a backtest?
Start with the end point and the window, then look for flat stretches, the deepest drawdown and how long the curve stayed below its peak. Finish by comparing the path with buy and hold and asking whether a few trades produced most of the gain.
What does a good equity curve look like for a trading strategy?
There is no single shape, but a curve that rises in many small steps, recovers from drawdowns quickly and does not depend on one or two trades is easier to trust. The example here ended up 57.27% yet spent 963 days underwater, which is the opposite pattern.
Why does my backtest equity curve go flat for months?
A flat curve means no open position. Trend filters keep a strategy in cash while price is below them: the example strategy was in the market 39.63% of the time and had one flat stretch of 108 days.
Look beyond returns. Explore your strategy’s drawdowns, risk metrics and trade history with CoinQuant. Analyze your strategy
Disclaimer:
Key Takeaway