Supertrend on Ethereum: 6 Years of Backtest Results
.png)
The Supertrend indicator is one of the most widely cited trend-following tools in crypto. Claiming it works is not the same as proving it works. We ran a systematic, no-code backtest on ETHUSDT using over six years of historical price data through CoinQuant, the AI trading platform, to find out. The result: +810.8% total return with a Sharpe ratio of 0.90. This article presents the full results, explains what they mean for ETH traders, and shows you how to replicate or modify the test yourself.
What Is the Supertrend Indicator?
Supertrend is an ATR-based (Average True Range) indicator that places a dynamic line on a price chart. The line acts as a trailing support level in uptrends and a resistance level in downtrends. When price closes above the Supertrend line, the indicator signals a bullish directional bias. When price closes below it, the bias flips bearish.
Two parameters define how Supertrend behaves: the ATR period (default 10) and the multiplier (default 3.0). The multiplier controls how far the band sits from the ATR midpoint. A higher multiplier filters out more noise but reacts more slowly to trend changes. A lower multiplier produces faster signals with more whipsaws. For this backtest, we used Supertrend(10, 3.0), the most commonly referenced default setting in crypto trading communities.
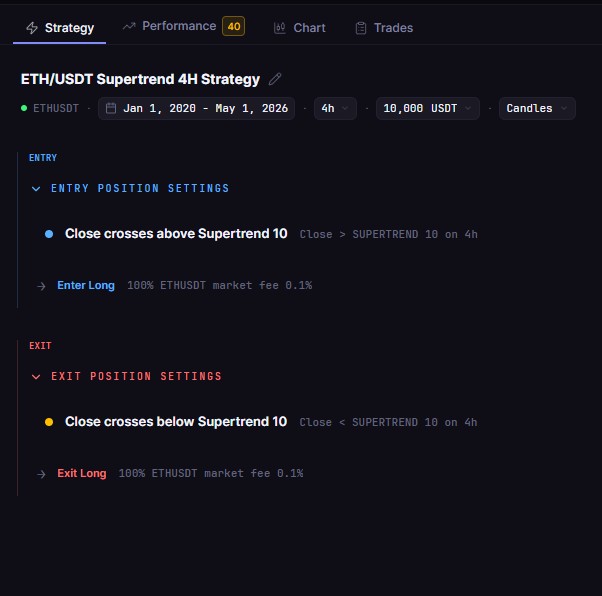
The Strategy We Tested
The rules are simple. Enter long when a 4-hour candle closes above the Supertrend line. Exit when a 4-hour candle closes below it. No leverage. Long-only. No additional filters. This isolates the raw signal quality of Supertrend on ETH's full price history.
Asset: ETHUSDT (Binance Spot)
Timeframe: 4-hour candles
Indicator: Supertrend(period=10, multiplier=3.0)
Entry: Close crosses above the Supertrend line (bullish flip)
Exit: Close crosses below the Supertrend line (bearish flip)
Test period: January 1, 2020 to May 1, 2026 (6+ years)
Initial capital: $10,000
Fees: 0.1% maker / 0.1% taker (included in all results)
Data source: Kaiko via CoinQuant
Six-plus years captures multiple full market cycles: the 2020 DeFi surge, the 2021 bull run to $4,800, the 2022 bear market, and the recovery phase through 2026. A strategy that only works in one regime is not a strategy. This test period forces Supertrend to perform across all of them.
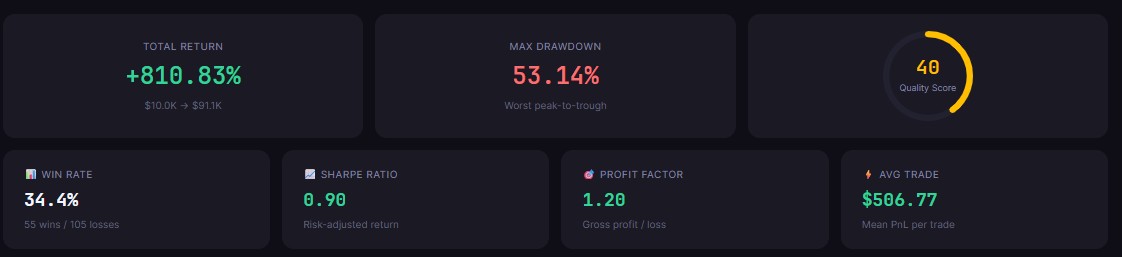
Backtest Results
Results from the CoinQuant backtest engine on ETH/USDT Supertrend 4H Strategy, using Kaiko institutional-grade data:
Total Return: +810.8% ($10,000 → $91,083)
Sharpe Ratio: 0.90
Win Rate: 34.4% (55 wins / 160 trades)
Max Drawdown: 53.14%
Total Trades: 160
Profit Factor: 1.20
Detailed Statistics
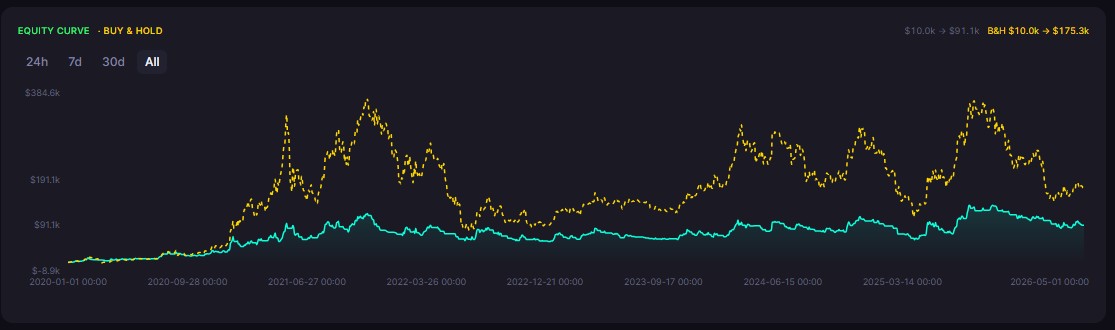
What +810.8% Over 6 Years Actually Means
An 810.8% return on a $10,000 starting position means the strategy grew that capital to approximately $91,083 before any withdrawal. That is the gross result with 0.1% fees applied on both entry and exit for every trade, a total of $22,822.51 in fees absorbed across 160 trades.
The Sharpe ratio of 0.90 adds critical context. A Sharpe above 1.0 is generally considered strong for a systematic strategy. At 0.90, this strategy sits just below that threshold, meaning the returns are meaningful relative to the volatility taken on, but not exceptional on a risk-adjusted basis. For comparison, a Sharpe of 0.46 was recorded on a plain BTC RSI(14) 4H strategy tested over the same general period. Supertrend on ETH substantially outperforms on raw return while also delivering a better risk-adjusted profile.
The 34.4% win rate deserves attention. Most traders expect a winning strategy to be right more than half the time. Supertrend wins on fewer than 1 in 3 trades. The strategy works because of asymmetry: the average winning trade ($8,900.77) is more than twice the average losing trade ($3,890.09), producing a payoff ratio of 2.29. A strategy with a 2.29 payoff ratio only needs to be correct 31% of the time to break even. At 34.4%, it generates consistent positive expectancy across 160 trades.
The 53.14% maximum drawdown is the most significant risk flag. At its worst, a strategy that ultimately returns +810.8% required holding through a loss of more than half of peak capital. That is a psychologically and practically difficult position for most traders. The recovery time of 32,880 hours (approximately 3.75 years) illustrates how long a drawdown can persist even in a strategy with a strong long-term result.
The result reflects Supertrend's core strength: it captures sustained trending moves and stays in them. ETH's price history from 2020 to 2026 contains several multi-month directional trends where a strategy that stays long through the entire move accumulates substantial gains. The 4-hour timeframe provides enough granularity to enter and exit cleanly without being whipsawed by hourly noise. The strategy spent 52.6% of the test period in the market, meaning it was in cash roughly half the time, a meaningful characteristic for traders who want defined exposure windows rather than continuous market participation.
Supertrend on ETH vs Other ETH Strategies
The +810.8% result stands out sharply against other indicator-based ETH strategies tested on CoinQuant over a shorter period (January 2024 to May 2026):
ETH Support and RSI Bounce (Donchian 4H + RSI below 40): 0% return, Sharpe 0
ETH S&R Breakout (Donchian 55 4H): -7.7% return, Sharpe -0.04
Those results reflect a common pattern: mean-reversion and breakout strategies on ETH have struggled in recent years, while trend-following approaches have fared better. Supertrend, as a pure trend-following tool, is structurally well-matched to ETH's historical behavior of extended directional runs.
That said, 6-year backtests include survivorship bias in market regimes. The 2020 to 2026 window was notably favorable for trend-following on crypto. Future periods may see more choppy, range-bound conditions where Supertrend underperforms. The 8 consecutive loss streak and Saturday underperformance pattern are worth monitoring in live deployment.
How to Run This Backtest Yourself
You do not need to write code to replicate or modify this test. CoinQuant's no-code strategy builder handles everything in minutes.
Create a free account on CoinQuant.
Open the Strategy Builder. Select ETHUSDT and set the timeframe to 4H.
Add the Supertrend indicator with period 10 and multiplier 3.0.
Set entry condition: close crosses above the Supertrend line.
Set exit condition: close crosses below the Supertrend line.
Set fees to 0.1% maker and 0.1% taker to match this test.
Set the backtest period to January 1, 2020 through May 1, 2026.
Run the backtest. All results populate instantly.
From there you can modify the ATR period, adjust the multiplier, add a trend filter like a 200-period moving average, switch to BTCUSDT for comparison, or test on shorter windows to see how results vary by market regime. Each variation runs in seconds on the same Kaiko institutional data used in this article.
Run this Supertrend backtest
Disclaimer:
This content is for educational and informational purposes only and does not constitute financial, investment, or trading advice. All strategies and examples are for illustrative purposes and do not guarantee results. Always conduct your own research before making financial decisions.
Key Takeaway