
Turtle Trading Strategy on Cardano: 20-Day Breakout, 10-Day Exit Backtested (2021-2026)

Does the turtle trading strategy crypto traders still quote work on an altcoin? We tested its best-known core, buy a 20-day breakout and sell a 10-day breakdown, on daily Cardano (ADAUSDT) from August 2021 to August 2026. It finished at -18.06% after 25 trades, while holding ADA lost 86.76%.
So the breakout rules did their defensive job: they kept the strategy out of most of a brutal decline. But they did not make money, and the path was rough, with a 72.78% Max Drawdown and only seven winning trades out of 25.
This article rebuilds the System 1 entry and exit in plain English, tests them with a 0.1% fee on every fill, compares them with ADA and Bitcoin buy and hold on the same window and reports the results without adjustment. No tuned parameters, no cherry-picked dates.
Who the Turtles Were and What System 1 Said
The Turtles were a group of trainees taught a complete, rule-based trend-following system, and their rules became one of the most quoted examples of mechanical trading. Their shorter-term entry, usually called System 1, is simple enough to test in a few lines.
- Entry: buy when price breaks above the highest high of the previous 20 days.
- Exit: sell when price breaks below the lowest low of the previous 10 days.
- Idea: a wide channel to enter trends and a tighter one to cut losers early.
Those breakout levels are exactly what a Donchian Channel draws. The CoinQuant Supported Elements documentation describes this pairing as "turtle style": "enter on a 20-bar Donchian breakout and exit on a shorter 10-bar Donchian breakout in the opposite direction."
The original system had more parts, and this test leaves them out:
- ATR-based unit sizing: position size scaled to volatility. Here every entry uses 100% of equity.
- Pyramiding: adding units as a trend extends. Here there is one position at a time.
- Skip filter: ignoring a new breakout after a winning one. Here every breakout is taken.
So this is a test of the turtle trading rules for entry and exit only, not the full money-management system.
The Exact Rules We Tested
The strategy is saved in the author's CoinQuant library as ADA Donchian 20/10 Turtle Breakout 1D 2021-2026. It was described in plain English, with no coding required, for example: "Buy ADAUSDT on the daily chart when the close crosses above the previous day's 20-day Donchian upper band. Sell when the close crosses below the previous day's 10-day Donchian lower band."
| Parameter | Setting |
|---|---|
| Strategy | ADA Donchian 20/10 Turtle Breakout 1D 2021-2026 |
| Instrument | ADAUSDT (spot, Binance) |
| Data source | Kaiko via CoinQuant |
| Timeframe | Daily (1D) |
| Tested window | 2021-08-01 to 2026-08-01 |
| First trade to last exit | 2021-08-06 to 2026-07-13 (no position open at the end of the test) |
| Entry | Close crosses above the Donchian Channel(20) upper band from the previous bar (the highest high of the prior 20 days), market order |
| Exit | Close crosses below the Donchian Channel(10) lower band from the previous bar (the lowest low of the prior 10 days), market order |
| Direction | Long only, one position at a time, no leverage |
| Initial capital | $10,000 |
| Position size | 100% of equity per entry |
| Fees | 0.1% taker on entry and 0.1% on exit, modelled on every fill (no slippage set) |
| Baselines (same window) | ADA Buy and Hold 1D 2021-2026; BTC Buy and Hold 1D 2021-2026 |
Using the previous bar's band matters. Today's close is compared with the channel built from the prior days, so a breakout means a genuinely new 20-day high, not a touch of a band that already includes today.
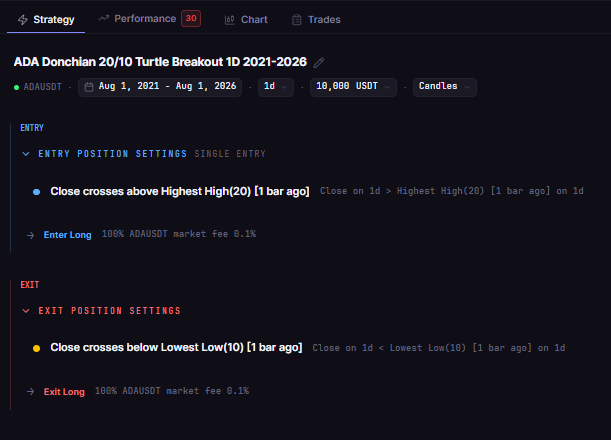
ADA Donchian 20/10 Turtle Breakout 1D 2021-2026 in the CoinQuant builder: enter on a close above the prior 20-day high, exit on a close below the prior 10-day low, on daily ADAUSDT.
Turtle Trading Strategy Crypto Test: Results vs ADA Buy and Hold
The breakout system turned $10,000 into $8,193.60, a Total Return of -18.06%. Holding ADA over the same five years left $1,324.39 (-86.76%), and holding Bitcoin finished at $15,733.43 (+57.33%).
| Metric | Turtle breakout | ADA buy and hold | BTC Spot Comparison |
|---|---|---|---|
| Strategy | ADA Donchian 20/10 Turtle Breakout 1D 2021-2026 | ADA Buy and Hold 1D 2021-2026 | BTC Buy and Hold 1D 2021-2026 |
| Total Return | -18.06% | -86.76% | +57.33% |
| Final Balance | $8,193.60 | $1,324.39 | $15,733.43 |
| Total Trades | 25 | 1 | 1 |
| Win Rate | 28.00% (7W / 18L) | n/a (single hold) | n/a (single hold) |
| Profit Factor | 0.95 | n/a | n/a |
| Sharpe Ratio | 0.16 | -0.02 | 0.44 |
| Max Drawdown | 72.78% | 95.15% | 76.63% |
| CAGR | -3.90% | -33.24% | +9.48% |
| Time in Market | 31.14% | 100.00% | 100.00% |
| Total Fees | $618.49 | $11.32 | $25.74 |
All three runs share the same window, capital, sizing and 0.1% fee, so the rows compare like with like. Win Rate and Profit Factor are not shown for buy and hold because each benchmark is a single trade.
Time out of the market explains much of the gap against ADA: the strategy was invested only 31.14% of the time, while holding ADA lost 86.76%. Against Bitcoin, though, it trailed badly, which is a reminder that avoiding a crash is not the same as earning a return.
Data note: the ADAUSDT daily series on CoinQuant is missing 2021-09-12 to 2021-09-14 (three days), and the platform does not flag the gap. No breakout trade was open then: the first trade closed on 2021-09-07 and the next opened on 2021-12-27. The buy and hold run does hold through the gap.
On the Performance tab, the results card marks this run "Statistically inconclusive": 25 trades, and it needs 50+ to rate. The platform's Buy and Hold benchmark carries no fees and ends at -86.73%, so the table uses the ADA Buy and Hold 1D 2021-2026 strategy (-86.76%), which pays the 0.1% fee on entry and exit.
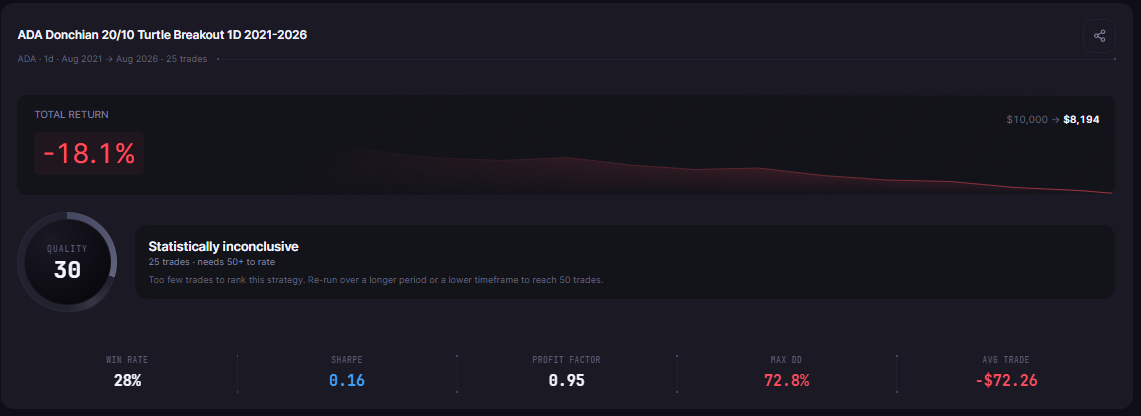
ADA Donchian 20/10 Turtle Breakout 1D 2021-2026 results card on the Performance tab, daily ADAUSDT, 2021-08-01 to 2026-08-01: Total Return -18.06%, Max Drawdown 72.78%, Profit Factor 0.95, Win Rate 28.00% and Sharpe Ratio 0.16 over 25 trades, marked Statistically inconclusive.
Where the Breakouts Paid and Where They Failed
A breakout system lives on a few big trends and pays for them with many small failures. This test shows both sides clearly.
The trends it caught
- 2021-08-06 to 2021-09-07: the very first breakout gained 78.97% after fees, a 79.25% price move, or $7,889.32.
- 2023-10-01 to 2024-01-03: a 109.13% gain after fees, or $7,458.60.
- 2024-11-07 to 2024-12-09: the best trade of the test, 146.49% after fees, or $14,603.06.
The breakouts that failed
The next two entries after the first winner show the cost. The breakout of 2021-12-27 lost 19.05% after fees (an 18.87% price fall), and the one of 2022-01-17 lost 30.30% after fees (a 30.13% price fall) in just four days.
The worst trade came straight after the best one. A breakout on 2025-03-02 reversed fast and closed on 2025-03-29 with a 40.85% loss after fees, or $10,030.67, giving back most of the previous gain.
That is how a 28.00% Win Rate and a Profit Factor of 0.95 fit together. The average winning trade made $5,371.03 and the average losing trade lost $2,189.09, but 18 losers against seven winners left gross losses slightly larger than gross profits.
What This Test Cannot Tell You
Twenty-five trades is still a small sample: the results card marks the run "Statistically inconclusive" because it needs 50+ trades to rate. A handful of large winners and losers account for much of the outcome.
- No ATR sizing or pyramiding: the full Turtle system managed risk very differently, so this is not a verdict on it.
- One asset, one window: daily ADAUSDT in a deep decline. In a long uptrend the same rules would behave differently.
- Costs: the 0.1% fee on entry and exit is included, but slippage was not modelled, and breakouts often fill at worse prices.
- No forecast: past results do not predict future returns.
For how Donchian breakouts compare with other channel rules, see Donchian Channel breakout on crypto vs Keltner. For the wider question of whether breakouts work at all, see breakout trading strategy: does it work on crypto?
The Practical Lesson
- It limited the damage: -18.06% against -86.76% for holding ADA, with a Max Drawdown of 72.78% against 95.15%.
- It did not make money: and it finished far behind holding Bitcoin (+57.33%).
- Few winners, big winners: seven of 25 trades won, and three of them made about four fifths of the gross profit.
- Rules alone are not the system: the original Turtles added volatility sizing and pyramiding, which this test leaves out.
As a cardano breakout strategy, the Donchian 20/10 pair worked more as a crash filter than a profit engine. In CoinQuant, an AI trading platform, you can test the same rules on another coin or window, add a trend filter such as a long moving average (CoinQuant supports multi-indicator and multi-timeframe conditions) or compare it with other approaches in crypto trading strategies explained. New traders can start with the best crypto trading strategy for beginners.
Build trading strategies on real data. No coding required.
Frequently Asked Questions
Does the Turtle trading strategy still work in crypto?
In this test its entry and exit rules did not make money on ADA: -18.06% after fees over 25 trades from 2021-08-01 to 2026-08-01. They did avoid most of the 86.76% loss from holding ADA, so they worked as risk control rather than as a source of profit here.
What are the original Turtle trading rules?
System 1 enters on a breakout above the previous 20-day high and exits on a break below the previous 10-day low. The full system also sized positions by volatility (ATR), added units as trends extended and skipped some breakouts after a winner.
Is a 20-day breakout strategy better than holding Cardano?
Over this window it lost far less (-18.06% against -86.76%) and had a smaller Max Drawdown (72.78% against 95.15%). It still lost money, so "better than a collapse" is not the same as "profitable".
Test the 20-day breakout on your own coin and window.
Disclaimer:
Key Takeaway