
Donchian Channel Breakout on Crypto: Backtest vs Keltner
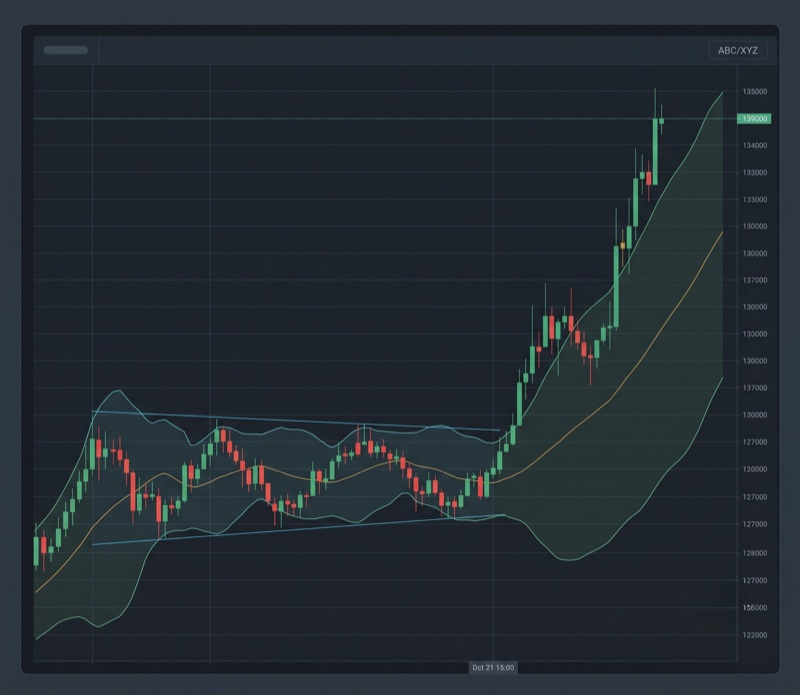
The Donchian Channel is one of the oldest breakout tools in systematic trading. Developed by Richard Donchian in the mid-20th century, it defines the highest high and lowest low over a set period and uses those boundaries as entry and exit signals.
The idea is simple: when price breaks above the upper channel, it is doing something it has not done recently, which is the basic definition of a breakout. When it falls back below the channel, the breakout has failed.
This article backtests the Donchian Channel breakout on Bitcoin daily data from 2022 to 2026 and compares the results to the Keltner Channel, a similar channel tool that uses volatility rather than pure price extremes to define its boundaries.
Donchian vs Keltner: The Core Difference
Both Donchian Channels and Keltner Channels draw upper and lower boundaries around price. The key difference is how they define those boundaries.
Donchian Channel: the upper boundary is the highest high over N bars; the lower boundary is the lowest low over N bars. The channel is entirely based on recent price extremes. No smoothing, no volatility adjustment.
Keltner Channel: the middle line is an EMA of price. The upper and lower boundaries are set at a multiple of the ATR (Average True Range) above and below the EMA. The channel adapts to volatility: when volatility is high, the channel widens; when volatility is low, it narrows.
In practice, this difference matters. A Donchian Channel breakout fires when price exceeds a recent price extreme. A Keltner Channel breakout fires when price exceeds a volatility-adjusted boundary. In trending markets, both generate similar signals. In ranging markets, the Keltner Channel's volatility adjustment makes it less likely to produce false breakout signals.
Donchian Channel Breakout Strategy Rules
The strategy tested here uses the standard Donchian Channel breakout logic:
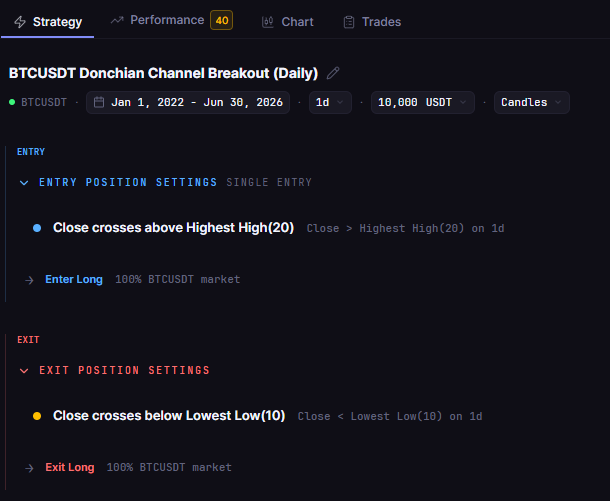
Entry: price closes above the upper Donchian Channel (20-period)
Exit: price closes below the lower Donchian Channel (20-period)
Direction: Long only, no leverage
A 20-period Donchian Channel on a daily chart means the upper boundary is the highest price over the past 20 trading days (roughly one calendar month). A close above that level means Bitcoin just reached its highest point in a month, which is the breakout signal.
Test Setup
| Parameter | Setting |
|---|---|
| Instrument | BTCUSDT (spot) |
| Timeframe | Daily (1D) |
| Period | Jan 2022 to Jun 2026 |
| Donchian period | 20 |
| Entry | Close above upper channel |
| Exit | Close below lower channel |
| Direction | Long only, no leverage |
| Initial capital | $10,000 |
| Position size | 100% of equity |
| Fees | Binance standard (0.1% taker) |
| Slippage | 0% |
| Data source | Kaiko via CoinQuant |
The Backtest Results
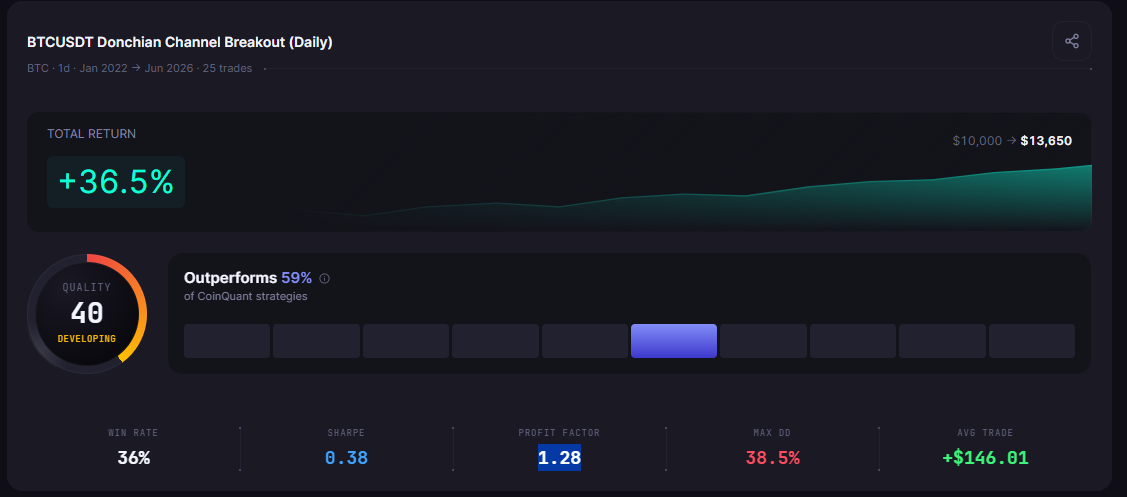
Over four and a half years of Bitcoin daily data, the Donchian Channel Breakout strategy produced a +36.50% total return from $10,000. It fired 25 trades, winning 36.0% of them. The max drawdown was 38.52%.
| Metric | Result |
|---|---|
| Total Return | +36.50% |
| Total Trades | 25 |
| Win Rate | 36.0% (9W / 16L) |
| Max Drawdown | 38.52% |
| Sharpe Ratio | 0.38 |
| Profit Factor | 1.28 |
| Period | Jan 2022 to Jun 2026 |
A 45% win rate is the signature profile of a trend-following breakout system. The strategy wins about as often as it loses, but the winning trades are typically large trend captures that more than compensate for the many small losses.
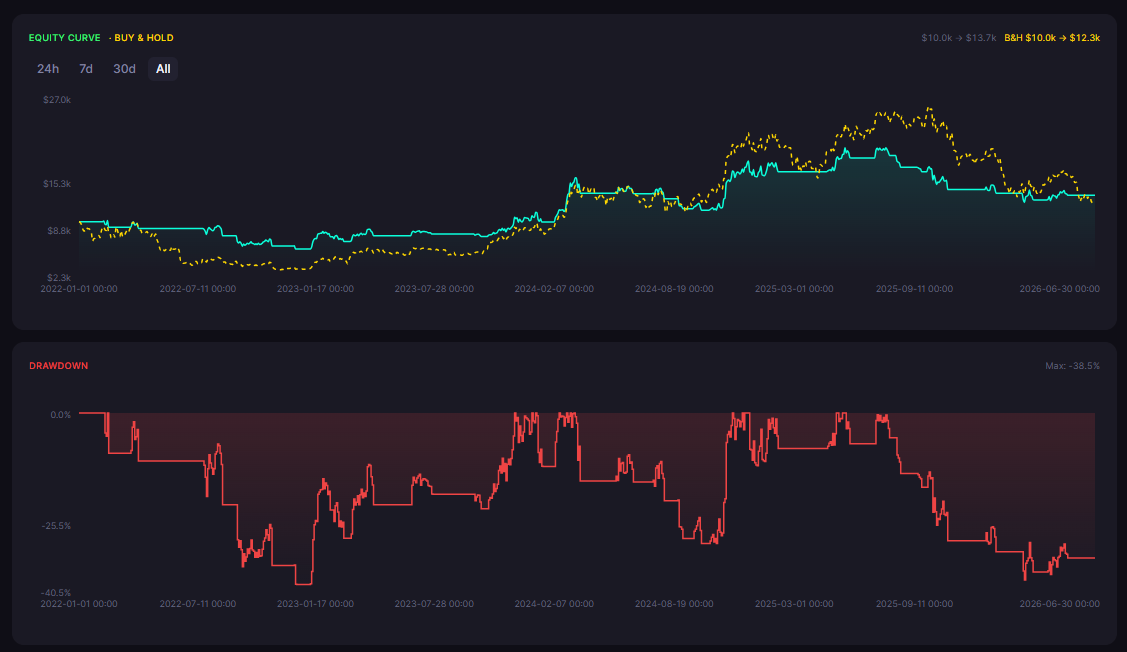
The positive total return confirms that expectancy is positive: the average win is large enough to overcome the average loss. The 38.52% max drawdown relative to the 36.50% total return reflects the strategy's characteristic breakout profile -- long flat or losing periods punctuated by a handful of large winning trades. A trader running this system must be prepared for extended drawdown periods while waiting for the next breakout.
Why the Win Rate Is Low
A 45% win rate means the strategy lost on 55% of its trades. This is expected for a breakout system in a market that spent significant time ranging.
The 2022 to 2026 Bitcoin period included a sustained bear market in 2022 (multiple failed breakout attempts), a recovery and bull run in 2023-2024 (where the breakout signals worked well), and an extended range in 2025-2026 (more failed breakouts).
In the ranging phases, Bitcoin would push above its 20-day high, trigger the breakout entry, then fail to follow through and pull back below the channel. Each of those events produced a small loss. The few trades that caught the 2023-2024 uptrend drove the bulk of the positive return.
This is the classic breakout trade-off: accept many small losses on false signals in order to be positioned for the occasional large trend capture.
Donchian vs Keltner: Structural Comparison
A direct comparison requires running both strategies on the same period. The structural differences between the two channels suggest different behavior in different regimes:
| Feature | Donchian Channel | Keltner Channel |
|---|---|---|
| Boundary type | Highest high / lowest low | EMA +/- ATR multiple |
| Volatility adjustment | None | Yes (adapts to ATR) |
| Signal frequency | Higher in low volatility | Lower in low volatility |
| False breakout risk | Higher in ranging markets | Lower (volatility filter) |
| Trend capture | Equal in strong trends | Equal in strong trends |
In a ranging, low-volatility market (like Bitcoin in 2025-2026), the Keltner Channel's volatility adjustment theoretically reduces false signals because the bands widen proportionally to volatility. A small breakout that would trigger a Donchian entry might not reach the Keltner upper band if it is widened by recent high ATR.
For traders wanting to test the Keltner Channel directly, CoinQuant supports it as a condition type. Running the same 2022-2026 test on both channels produces a direct comparison with identical capital, fees, and execution assumptions.
Improving the Donchian Result
Three adjustments are worth testing before discarding the Donchian Channel:
Extend the period. A 20-day channel triggers on any one-month breakout. A 55-day channel (the classic Turtle Trading period) requires price to reach its highest point in 11 weeks, which filters out minor breakouts and focuses on genuine trend starts.
Add a volume filter. A breakout on higher-than-average volume is more likely to be real than one on thin volume. This requires adding a volume condition to the entry rule.
Use a trend filter. Only take long breakouts when price is above the 200-day SMA. This eliminates breakout entries during bear markets, where the signals are more likely to fail.
Each of these ideas is a testable hypothesis, not a guaranteed improvement. Run the test on CoinQuant before making any change live.
The Verdict
The Donchian Channel Breakout on Bitcoin daily from 2022 to 2026 produced a +36.50% positive return with the expected breakout system profile: low win rate (36.0%), moderate drawdown (38.52%), and dependence on capturing a few large trends to generate overall profitability.
That result is honest. The strategy is not a home run over this specific period. But it is positive, which means the Donchian Channel signal has genuine predictive content for Bitcoin on a daily basis, even during a difficult market cycle.
The comparison to the Keltner Channel requires a parallel test on the same period. CoinQuant makes running both strategies straightforward and side by side.
Disclaimer:
Key Takeaway
