Breakout Trading Strategy: Does It Work on Crypto? (Backtested)

Breakout trading is one of the oldest strategies in markets: buy when price breaks above resistance and momentum carries it higher. In crypto, breakouts can deliver explosive returns or they can fake out and stop you immediately. We tested a Bollinger Bands breakout strategy on Ethereum using CoinQuant. Over 6 months, it returned +94.84% with a 1.95 Sharpe ratio. Here's exactly how it worked, when it succeeded, and when it failed.
What Is a Breakout Trading Strategy?
A breakout strategy enters a trade when price closes above a significant level, a resistance zone, a moving average, or a volatility band. The premise is simple: when price breaks through a key barrier, momentum builds and the move continues.

We tested this concept using Bollinger Bands (20,2) on ETH/USDT with a 4-hour timeframe. Bollinger Bands plot a middle SMA plus upper and lower bands at ±2 standard deviations. When price closes above the upper band, it signals a volatility expansion, a potential breakout. We combined this with a squeeze entry: if price touched the lower band after a period of low volatility, we also entered long, anticipating the expansion.
The strategy: Enter long when price closes above the upper Bollinger Band (breakout) OR when price closes below the lower band (squeeze). Exit when price closes back below the lower band. Starting capital: $10,000. Fee per trade: 0.1%. All 21 trades were long-only.

Breakout Backtest Results
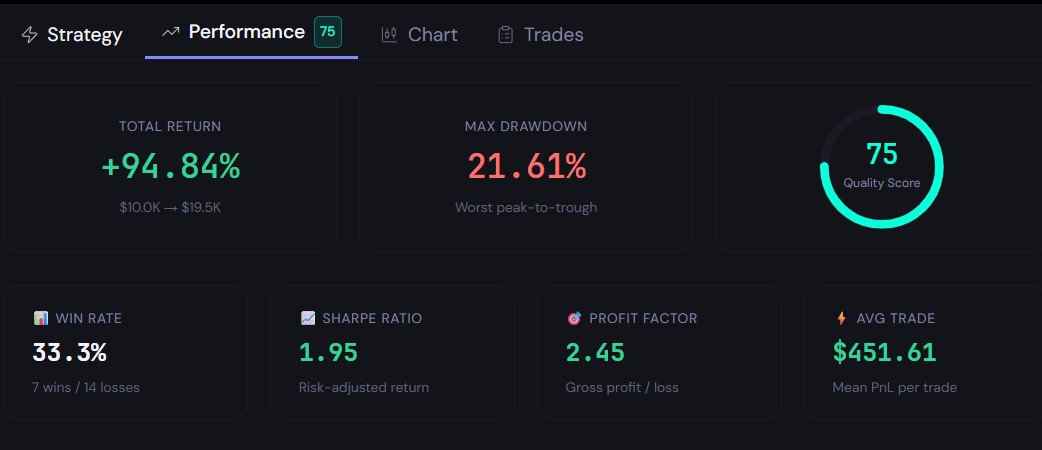
We ran the strategy on ETH/USDT 4H data from November 2025 through May 2026. Here's what 6 months produced:
Total Return: +94.84%
Portfolio: $10,000 → $19,484
Max Drawdown: 21.61%
Win Rate: 33.3% (7 wins / 14 losses)
Sharpe Ratio: 1.95
Profit Factor: 2.45 (gains were nearly 2.5x losses)
Avg Trade: +$451.61
Total Trades: 21
Time in Market: 57.8%
CAGR: 94.8%
Sortino Ratio: 1.74 | Calmar Ratio: 4.39
The strategy placed 21 trades over 6 months. Only 7 were winners, a 33.3% win rate. But the average win ($2,289.15) was nearly 5x the average loss ($467.16). That's a payoff ratio of 4.90. This is the breakout trader's reality: you lose more often than you win, but when you catch a real breakout, it more than pays for the fakeouts.
The best single trade returned $6,477.03. The worst lost $906.18. Consecutive losses maxed out at 4 in a row, testing the patience of any trader. But the 94.84% total return shows the math works out over enough trades.
When Breakouts Work and When They Fail
Breakout strategies thrive in trending, volatile markets. During the Nov 2025-May 2026 period, ETH experienced multiple trending rallies, including the Q1 2026 surge. The BB(20,2) breakout entry caught these moves early. When bands expand after a squeeze, the ensuing move tends to be directional and sustained.
Where breakouts struggle: ranging, choppy markets. During sideways consolidation (which dominated Dec 2025-Jan 2026 on ETH), the strategy generated false signals. Price would close above the upper band, trigger an entry, then immediately reverse. These fakeouts produced the 14 losing trades.
The strategy's drawdown patterns confirm this: worst performance came on Wednesdays, best on Mondays, suggesting weekend price action (thin liquidity, drift) set up Monday breakouts, while mid-week reversals hurt.
How to Filter Breakouts for Better Results
The raw 33.3% win rate leaves room for improvement. Here are three filters that could sharpen this strategy:
Volume confirmation: Only take breakouts when the breakout candle's volume is above the 20-period average. Low-volume breakouts are far more likely to fail.
Volatility regime filter: Only trade when the Bollinger Band width is above its 20-period average. This ensures you're in expansion phases, not contraction.
Exit at middle SMA instead of lower band: Using the middle SMA (20-period) as the exit would lock in profits faster on winning trades instead of waiting for price to cross all the way back to the lower band.
CoinQuant allows you to add these conditions directly to your strategy rules with no coding required.
How to Run This Backtest Yourself
Open CoinQuant and select ETH/USDT on the 4H timeframe. Add Bollinger Bands (20,2). Set two entry conditions connected by OR:
Entry 1: Close > Upper BB(20,2) → Enter Long, 100% capital, 0.1% fee
Entry 2: Close < Lower BB(20,2) → Enter Long, 100% capital, 0.1% fee
Exit: Close < Lower BB(20,2) → Exit Long
Set the date range to Nov 2025 - May 2026 with $10,000 starting capital. Hit run. You'll get the full breakdown, every trade, every metric in under a minute.
Disclaimer:
This content is for educational and informational purposes only and does not constitute financial, investment, or trading advice. Past performance does not guarantee future results. Trading cryptocurrencies involves substantial risk of loss.
Key Takeaway