
How to Read a Backtest Report: Every Metric Explained (for AI and Humans)

You ran a backtest. A table full of numbers came back. Now what?
Most traders either ignore the numbers they do not recognize or fixate on the one they do: total return. Both approaches lead to bad decisions. A strategy with a 90% return might be untradeable. A strategy with a 40% return might be excellent. The difference lives in the other metrics.
This is a plain-language guide to every core metric in a backtest report, what each one actually measures, what a healthy range looks like, and what most people get wrong when reading it.
What Is Total Return and How Do I Read It?
What it is: Total return is the percentage gain or loss on your starting capital over the full test period. If you started with $10,000 and ended with $14,200, total return is +42%.
What good looks like: Depends entirely on the period. A +42% total return across seven years is mediocre. The same return across eight months is strong. Never read total return without also checking the test length.
Common mistake: Treating total return as the headline number and ignoring everything else. A strategy can show a 200% total return while drawing down 85% along the way. That is not a liveable experience for most traders.

What Is CAGR and Why Does It Matter More Than Total Return?
What it is: Compound Annual Growth Rate normalises return across time. It tells you the annualised growth rate that, compounded each year, would produce the total return over the test period.
What good looks like: A CAGR above 20% annualised in crypto is competitive. Anything above 40% sustained over several years deserves serious scrutiny of the risk metrics before you get excited.
Common mistake: Comparing two strategies with different test periods using total return. A three-year strategy at +90% total return looks worse than a one-year strategy at +75%, but the CAGR tells a very different story.
What Is Win Rate and Why Can a High Win Rate Still Lose Money?
What it is: Win rate is the percentage of closed trades that ended in profit. If 60 of 100 trades were profitable, the win rate is 60%.
What good looks like: Win rate alone means nothing. A 70% win rate with small wins and large losses can destroy an account. A 40% win rate with large wins and small losses can compound well.
Common mistake: This is the most common misread in all of backtesting. Traders assume a high win rate means a good strategy. It does not. Win rate only has meaning when read alongside the payoff ratio and profit factor.
What Is Profit Factor and What Is a Good Number?
What it is: Profit factor divides gross profits by gross losses across all trades. A profit factor of 1.5 means the strategy earned $1.50 for every $1.00 it lost in aggregate.
What good looks like: Anything below 1.0 means the strategy lost money. Between 1.0 and 1.3 is marginal. Above 1.5 starts to show a real edge. Above 2.0 is strong, though you should then check whether it is due to a small number of outsized wins.
Common mistake: Assuming profit factor is stable. It can degrade sharply in live trading if the few large wins that drove it do not repeat. Check how evenly distributed the winning trades are.
This is one of the most important backtest metrics explained in plain terms. Profit factor meaning becomes clear when you realise it is a direct ratio of money made versus money lost, with no adjustment for timing or risk.
What Is Payoff Ratio?
What it is: The payoff ratio (also called the reward-to-risk ratio) divides the average winning trade by the average losing trade. A payoff ratio of 2.0 means winning trades were, on average, twice as large as losing trades.
What good looks like: A payoff ratio above 1.5 combined with a win rate above 40% is a solid foundation. High payoff ratios with lower win rates are fine. Low payoff ratios demand higher win rates to be profitable.
Common mistake: Reading payoff ratio in isolation. A payoff ratio of 3.0 with a win rate of 20% means you are losing 80% of your trades. That is a psychologically difficult strategy to hold through a losing streak, regardless of what the math says.
What Is the Sharpe Ratio in Crypto?
What it is: The Sharpe ratio measures return per unit of total volatility. It divides the strategy's excess return (above the risk-free rate) by the standard deviation of its returns.
What good looks like: In traditional finance, a Sharpe ratio above 1.0 is considered acceptable. In crypto, given the higher baseline volatility, a Sharpe above 0.8 on a crypto strategy is respectable. Above 1.5 is strong.
Common mistake: A high Sharpe ratio on a short test period is nearly meaningless. Sharpe ratios stabilise over many trades and multiple market regimes. A 90-day backtest with a Sharpe of 2.0 is noise, not signal. Sharpe ratio crypto interpretation always requires checking the sample size alongside it.
What Is the Sortino Ratio and How Is It Different?
What it is: The Sortino ratio is similar to the Sharpe ratio but it only penalises downside volatility. If a strategy's returns are volatile on the upside (large gains), the Sortino ratio treats that as a feature, not a flaw.
What good looks like: The Sortino ratio is almost always higher than the Sharpe ratio for the same strategy. A Sortino above 1.0 is solid. If your Sortino is significantly higher than your Sharpe, the strategy's volatility is mostly on the winning side, which is a positive sign.
Common mistake: Ignoring Sortino entirely because Sharpe is more widely known. For trend-following strategies with asymmetric return profiles, Sortino gives a fairer picture of risk-adjusted performance.
What Is the Calmar Ratio?
What it is: The Calmar ratio divides annualised return by maximum drawdown. It tells you how much return the strategy generated per unit of its worst historical loss.
What good looks like: A Calmar ratio above 0.5 is reasonable. Above 1.0 means the strategy earns more annually than its worst drawdown. Above 3.0 is exceptional and warrants scrutiny.
Common mistake: Overlooking Calmar in favour of Sharpe. For traders who are particularly sensitive to drawdown (most people, once they experience it live), Calmar is the more practically relevant ratio.
What Is Max Drawdown and Why Does It Matter So Much?
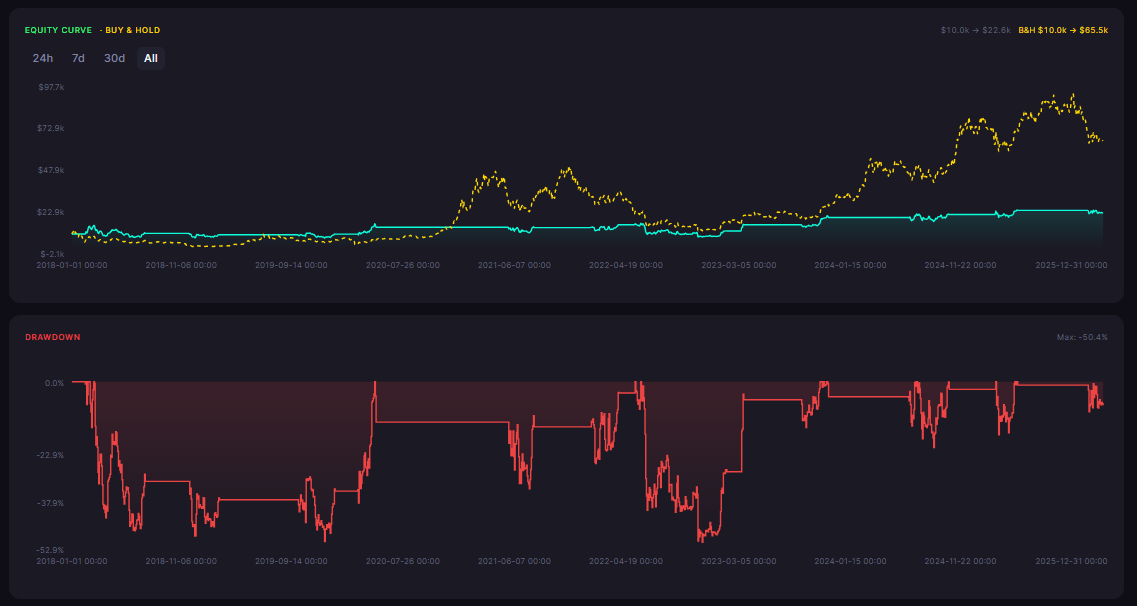
What it is: Max drawdown measures the largest peak-to-trough decline in equity during the test period. If the account grew to $15,000, fell to $6,000, and later recovered, the max drawdown was 60%.
What good looks like: Below 20% is conservative. Between 20% and 40% is common for active strategies. Above 60% is difficult to hold through live, regardless of ultimate returns.
Common mistake: Assuming you will hold through the max drawdown in real life. Most traders abandon a strategy well before the bottom. A max drawdown that looks acceptable on paper becomes unbearable at 2 AM when it is real money.
What Is Time in Market?
What it is: Time in market is the percentage of the test period where the strategy held an open position. A strategy with 25% time in market was in a trade for one quarter of the period and in cash for the rest.
What good looks like: Neither high nor low is inherently better. Low time in market can mean you missed a lot of gains. High time in market means you absorbed all the volatility. The key is whether the time in market was used efficiently, which the other metrics reveal.
Common mistake: Praising a strategy for low time in market as if that makes it safer. Being in cash is only safer if the strategy's returns when deployed are strong enough to justify the selectivity.
What Is Total Trades and Why Does Sample Size Matter?
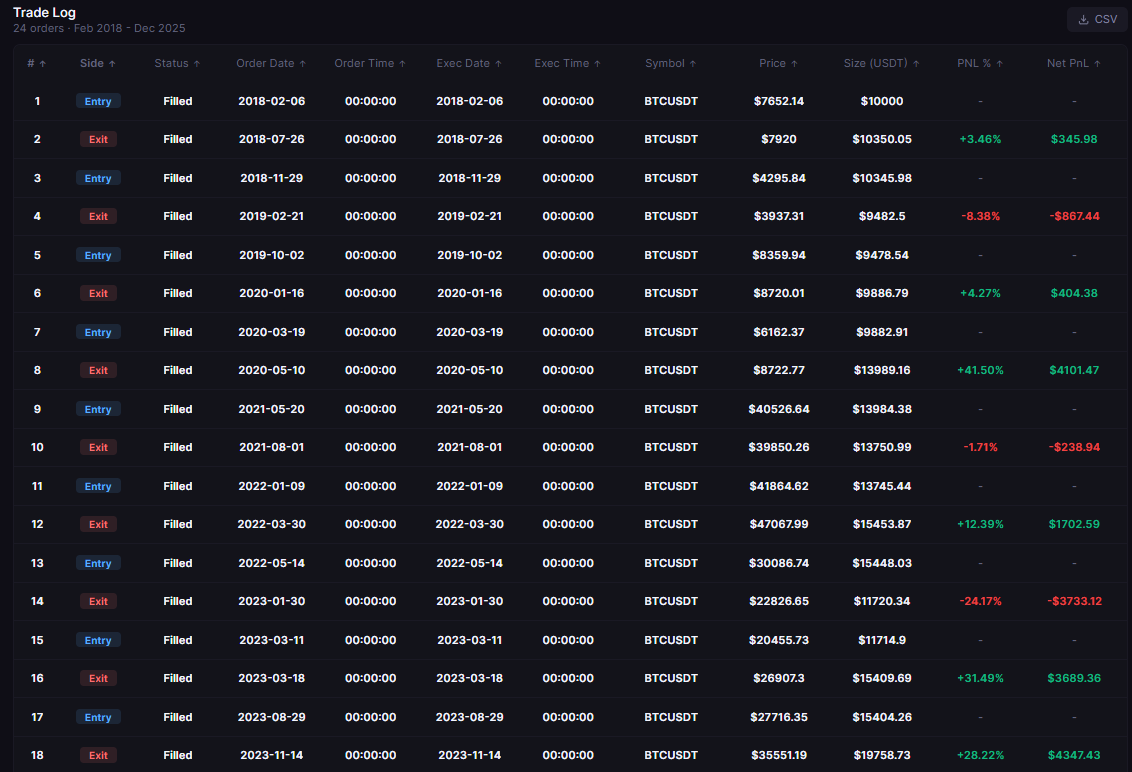
What it is: Total trades is the count of closed positions over the test period. It is the sample size for everything else in the report.
What good looks like: A minimum of 30 trades is the floor for any statistical claim. Above 100 trades gives more reliable metrics. A 10-trade backtest with a 90% win rate is essentially meaningless.
Common mistake: Running a backtest over five years but using a very high timeframe that only generates 12 trades. The strategy appears tested over a long period, but the actual sample is too small to draw conclusions. Crypto backtesting results with fewer than 30 trades should carry an explicit uncertainty warning.
What Is the Quality Score?
What it is: CoinQuant's Strategy Quality Score (SQS) is a 0-100 composite that aggregates multiple risk-adjusted metrics into a single number. It factors in return, drawdown, win consistency, trade frequency, and fee impact. It is designed to surface strategies that look good on multiple dimensions at once, not just one.
What good looks like: Above 60 is solid. Above 75 is strong. Strategies in the top tier of the CoinQuant library typically score above 70 on SQS, combined with strong individual metrics.
Common mistake: Using SQS as the only filter. A Quality Score of 80 is a useful starting point, but you should still read the underlying metrics to understand how the score was earned and where the risk sits.
What Is the Impact of Fees on a Backtest?
What it is: Fees in a backtest represent the simulated trading costs deducted from returns. CoinQuant applies realistic maker/taker fees per trade and reports the total cost separately so you can see exactly how much friction the strategy incurred.
What good looks like: Fee impact below 5% of gross profit is manageable. Strategies with very high trade counts (hundreds of trades) need careful scrutiny because fees compound against them.
Common mistake: Running a backtest without fees and then wondering why live performance diverges. Fees are not optional. A strategy that is profitable before fees but marginal after them is not a viable strategy.
Quick Reference: All the Core Metrics in One Table
Practical Takeaways for Reading Any Backtest Report
Reading a backtest well is a discipline. Here is how to approach it:
Start with Total Trades first. If the sample is under 30, do not spend time on the other metrics yet.
Read Profit Factor and Max Drawdown together. A strategy needs both to be defensible.
Ask whether you could psychologically hold through the max drawdown shown. If not, the strategy is not for you regardless of the return.
Compare Sharpe and Sortino to understand whether the strategy's volatility is the good kind or the bad kind.
Check the Quality Score as a composite signal, then verify the individual metrics that drive it.
Always confirm fees are included in the numbers you are reading.
No single metric tells the whole story. Every metric in this glossary is one piece of a connected picture.
The goal of reading a backtest report is not to find a perfect number. It is to understand what the strategy actually does, where the risk sits, and whether that risk profile is one you can execute consistently in a live account.
Run your own backtest and read every metric yourself, for free, on CoinQuant. Read your own backtest report free on CoinQuant
Disclaimer:
This content is for educational and informational purposes only and does not constitute financial, investment, or trading advice. All strategies and examples are for illustrative purposes and do not guarantee results. Always conduct your own research before making financial decisions.
Key Takeaway