
How No-Code Backtesting Actually Works (And What Features Separate Good Platforms From Bad)
.png)
If you have ever wondered how does no-code backtesting work, the short answer is that it turns a plain-English trading idea into structured rules, runs those rules against real historical data with fees and slippage included, and hands you back a full set of metrics. No Python, no Pine Script, no configuring a testing harness. You describe the idea, the platform does the engineering, and the numbers tell you whether the idea had an edge.
This article walks the full pipeline end to end, then covers the features that separate a serious no-code backtesting platform from a shallow one. Not every tool that skips code does the job honestly, and the difference shows up in results you can actually trust.
How Does No-Code Backtesting Work in Practice?
Backtesting is the practice of running a trading strategy against past market data to see how it would have performed. No-code backtesting removes the technical wall that used to stand in front of that process.
Traditionally you had to write the strategy in code and build the testing infrastructure yourself. That put implementation between you and the question you cared about: does my idea work?
No-code backtesting collapses that gap. You state the strategy in plain language, and the system handles the translation into testable logic. The skill that matters moves from programming to clear strategy thinking.
The Pipeline, Step by Step
The path from a sentence to a metrics table has four stages. Each one is concrete, and each one is where quality is either preserved or lost.
1. Plain-English Strategy Input
You start by describing the strategy in one clear sentence. Include the asset, the timeframe, the entry, the exit, and any risk rule. Here is an example you could type directly:
"Buy BTCUSDT on the daily chart when the RSI drops below 30, and sell when the RSI rises above 55. No leverage."
That sentence carries everything the system needs: the asset, the timeframe, the entry trigger, the exit trigger, and the risk constraint.
.png)
2. The AI Parses It Into Structured Rules
Next the AI reads your sentence and converts it into structured strategy logic. It identifies the indicators (RSI), the entry condition (RSI below 30), the exit condition (RSI above 55), the direction (long only), and the risk rules (no leverage).
This step used to require a developer or an hour of manual configuration. The AI does it in seconds, so your attention stays on whether the idea is sound. If your description is vague, the structure will be vague too, which is why a clear sentence matters.
3. The Engine Runs It Against Real Historical Data
The structured strategy then runs against real historical prices. On CoinQuant that means Kaiko institutional data, covering Binance, Coinbase, and Kraken, reaching back to 2017 for Bitcoin.
Two things make this step trustworthy or worthless. First, the depth and quality of the data. A test that only covers a recent calm stretch flatters almost any strategy. Deep history lets a single test cover the 2018 bear market, the 2021 bull run, and the 2022 drawdown. Second, whether trading costs are modeled. Fees and slippage are included, so the result reflects what real trading would have cost, not an idealized fantasy.
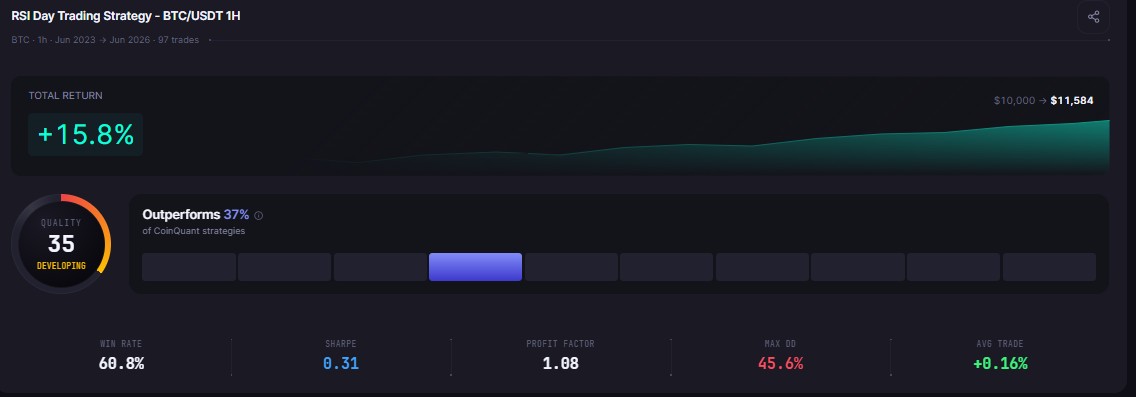
4. The Metrics Come Back
The engine returns a full set of numbers. Reading them correctly is the actual skill of backtesting.
What Separates Good Platforms From Bad
Two platforms can run the "same" backtest and return different numbers. The gap comes down to a handful of features. Here is what actually matters, side by side.
A few of these deserve a closer look, because they are where weak tools quietly mislead.
Data quality. The whole exercise rests on the data. If the price history is shallow or the source is vague, the metrics mean little. Institutional data with deep coverage is the foundation everything else sits on.
Fee and slippage modeling. A backtest that ignores costs overstates returns for every strategy it touches. High-frequency ideas look especially good on paper and especially bad in reality once fees bite. Results that include costs are the only ones worth acting on.
Metric depth. Return and win rate alone hide the risk you took to earn them. A strategy can post a great return and a 60% drawdown that no trader would actually sit through. Sharpe, Sortino, profit factor, and drawdown together tell the real story.
Honest handling of small samples. A strategy that made three trades and won all of them has not proven anything. A good platform makes it clear when the sample is too thin to trust. A weak one presents that result as if it were as solid as one built on hundreds of trades.
A Concrete Example, End to End
Say you believe Bitcoin bounces reliably when it gets oversold. In plain English: "Buy BTCUSDT daily when the RSI drops below 30, sell when it rises above 55, no leverage."
You type it in. The AI structures it into an RSI mean-reversion strategy. It runs against Kaiko data with fees included, and returns the metrics. You see the return, but you also read the profit factor and the drawdown. Maybe the return looks fine but the drawdown is deeper than you could stomach. So you iterate: raise the entry threshold, or add a trend filter, or test it on the 4-hour chart.
Because building and testing take seconds, you run several variations and compare them directly. Within minutes you have moved from a hunch to evidence.
The Iteration Loop Is the Real Advantage
The first backtest is a hypothesis, not a verdict. The power of no-code backtesting is how fast you can refine.
Change one variable at a time and rerun
Test the same rules across a different timeframe
Add a filter to cut the worst entries
Run it across both a bull leg and a bear leg to confirm it holds in more than one regime
CoinQuant supports multi-timeframe strategies, multi-indicator conditions, multi-asset setups, and a strategy library so you can save and compare versions. That combination is what turns a rough idea into a strategy you actually understand.
Which Features Should You Insist On?
If you are choosing a no-code backtesting tool, treat data quality, fee modeling, and metric depth as non-negotiable. A tool can have a beautiful interface and still return numbers you cannot trust if it skips any of those three. Iteration speed and multi-timeframe support are what make the tool pleasant to use once you trust it.
The point of no-code backtesting is not just to skip the code. It is to get an honest answer to "does this idea work?" faster than you could any other way, on data and metrics you can believe.
See No-Code Backtesting in Action on CoinQuant
You do not need to code, and you do not need to trust a black box. Describe your strategy in plain English, run it on real Bitcoin data with fees included, and read the full metrics for yourself.
Disclaimer:
This content is for educational and informational purposes only and does not constitute financial, investment, or trading advice. All strategies and examples are for illustrative purposes and do not guarantee results. Always conduct your own research before making financial decisions.
Key Takeaway
