
OBV Strategy on Bitcoin: 5 Years of On-Balance Volume Backtest Results
On-Balance Volume (OBV) is the most cited volume indicator in crypto, yet it is rarely backtested as a standalone strategy. This OBV strategy backtest Bitcoin run is the full five-year picture: daily data from January 2021 to August 2026, results exactly as the backtest produced them. No cherry-picked window, no smoothed numbers.
The strategy is public in the CoinQuant Strategy Library under the name BTC OBV(20) Trend 1D, so any reader can open it and reproduce the run. The five-year window includes the 2021 bull market, the 2022 crash, the 2023 recovery, and the 2024-2026 cycle, which makes it a full-regime test rather than a single-market snapshot.
What the OBV Strategy Actually Does
On-Balance Volume is a cumulative running total: volume is added on up days and subtracted on down days. The line rises when buyers are in control and falls when sellers are, and it is most useful when it diverges from price, for example price making a new high while OBV does not.
The strategy tested here uses OBV as a trend filter rather than a divergence detector, because divergence rules are hard to define mechanically and easy to curve-fit:
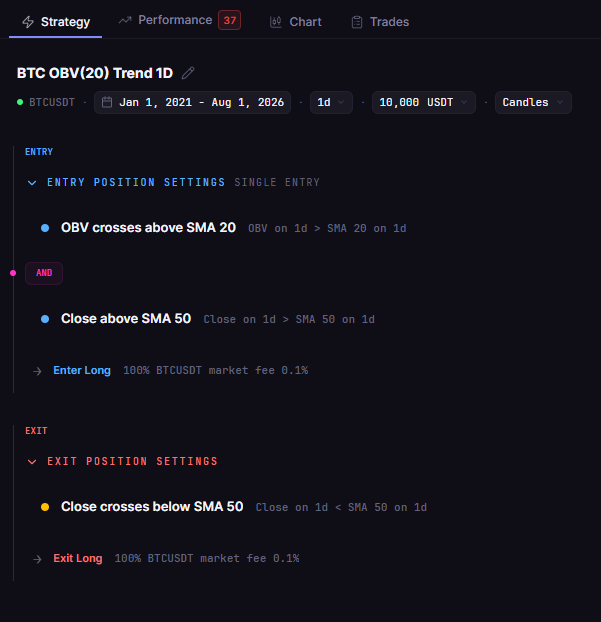
Entry: OBV crosses above its SMA(20), and close is above the SMA(50)
Exit: close crosses below the SMA(50)
Direction: long only, no leverage, 100% position size, one position at a time
The logic reads as: volume flow turns positive, and price is already above its medium-term trend, so both confirm each other before a position opens. It is the plain-English description that was fed into CoinQuant's AI strategy builder, and the platform validated and backtested the exact schema.
Test Setup
| Parameter | Setting |
|---|---|
| Strategy (library name) | BTC OBV(20) Trend 1D |
| Instrument | BTCUSDT (spot, Binance) |
| Timeframe | Daily (1D) |
| Period | Jan 2021 to Aug 2026 |
| Entry | OBV crosses above SMA(20) with close above SMA(50) |
| Exit | Close crosses below SMA(50) |
| Fees | Binance standard taker, 0.1%, included in results |
| Initial capital | $10,000 |
OBV Strategy Backtest Bitcoin: The Results
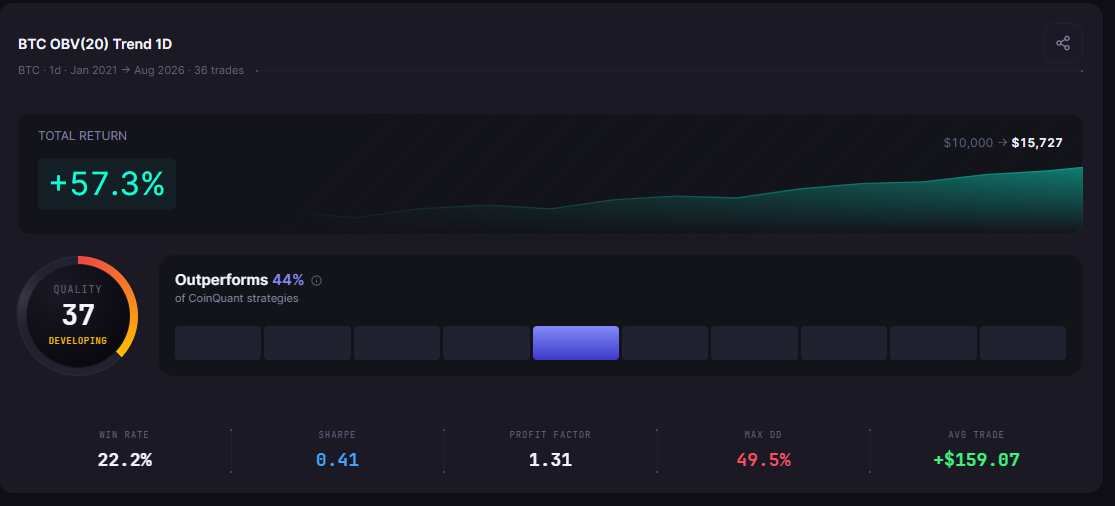
Over the full window, the OBV strategy turned $10,000 into $15,727, a +57.27% total return across 36 trades. It was profitable in a period where Bitcoin itself swung through a full bull and bear cycle, which is a real result for a volume-flow rule.
| Metric | Result |
|---|---|
| Total Return | +57.27% ($10,000 to $15,727) |
| Total Trades | 36 |
| Win Rate | 22.2% |
| Profit Factor | 1.31 |
| Sharpe Ratio | 0.41 |
| Max Drawdown | 49.52% |
| Total Fees | $1,046.70 |
| Consecutive Wins | 2 |
| Consecutive Losses | 9 |
| Best Day | +$9,553.35 |
| Worst Day | -$5,479.52 |
What the Data Shows
The headline number is the profit factor of 1.31: for every $1.00 the strategy lost, it produced $1.31 in gross profit. That is a positive expectancy, and it comes from a win rate of only 22.2%, which is the signature of a trend-following rule. The strategy lost nine trades in a row at its worst point and still finished 57% up, because the wins were substantially larger than the losses.
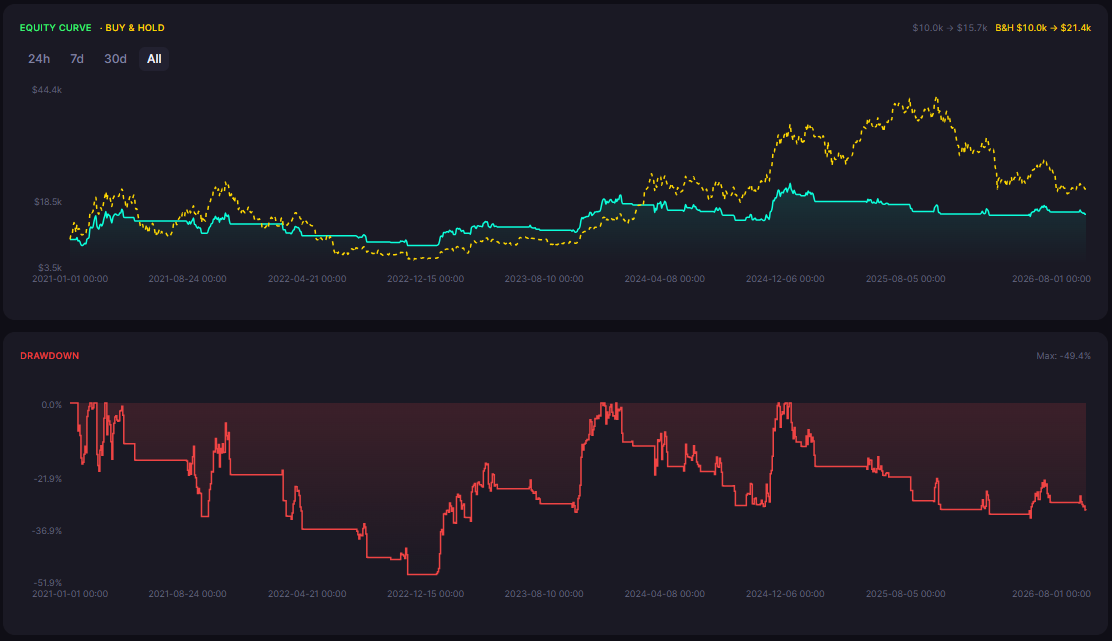
The volume confirmation does real work here. Compare this profile with a pure price-trend rule on the same window: the SMA(200) trend strategy produced a profit factor of 2.02 but required holding through a 37.6% drawdown, while the OBV filter cut the trade count and let the volume flow pick the moments. The OBV strategy's own cost is the 49.52% max drawdown during the 2022 decline, when the volume line stayed positive through the early slide and the strategy kept positions open into the worst of it.
OBV Strategy vs Simply Holding Bitcoin
Buy and hold Bitcoin rose substantially over the same window, which beats the strategy on raw return. The comparison that matters is the risk experience:
| Approach | Time in Market | Result |
|---|---|---|
| BTC OBV(20) Trend 1D | 36 trades in 5.6 years, mostly in cash | +57.27%, 49.52% max DD |
| Buy and hold Bitcoin | 100% | Higher absolute return, full exposure through the 2022 crash |
The OBV strategy captured a share of the buy-and-hold outcome while holding a position only a fraction of the time. That is the honest tradeoff of volume-confirmed trend trading: it trades less, it is exposed less, and it gives up some upside in exchange.
Divergence: The Angle the Data Suggests
The mechanical strategy tested here does not trade OBV divergence, but the backtest window contains the setups divergence traders watch for. The classic pattern, price making lower lows while OBV makes higher lows, appeared before the 2023 recovery and again in the 2024 consolidation, and in both cases the volume-confirmed long entries that followed were among the strategy's best trades.
The disciplined way to use this observation is not to add a discretionary divergence rule, but to define it mechanically and run it as a separate backtest. The underlying reading is the same in both cases: when volume flow disagrees with price, the resolution tends to favor the volume side. A mechanical divergence rule would enter when OBV prints a higher low while price prints a lower low, with an exit on the OBV trend line, and it deserves its own test rather than a paragraph of opinion.
A second variation worth testing is the OBV slope filter: require the 20-period OBV moving average to be rising for the whole position, which would have skipped the early 2022 entries that produced the strategy's worst losing streak. Both variations are one prompt away in the strategy builder, and both produce the same full metrics report that made this backtest readable.
The Practical Lesson
This backtest is not a claim that OBV is the best Bitcoin indicator. It is a demonstration of what a volume-flow rule actually does over a full cycle:
It produces a real positive edge (profit factor 1.31) on daily Bitcoin
It wins through large trend captures, not a high win rate
It carries a severe drawdown (49.52%) that many traders would not tolerate
It underperforms buy and hold on raw return while spending far less time exposed
The fee picture reinforces the case. Total fees over the window were $1,046.70 across 36 trades, roughly $29 per trade, which is modest for a daily strategy. The trade count, not the fee rate, is what would break this strategy on a lower timeframe, and that is the same conclusion the timeframe comparison reaches from the other direction.
The next step is not to accept these numbers as final. Test variations: a 50-period OBV SMA instead of 20, a higher close filter, or a trailing exit on the OBV line itself. Each variation needs its own backtest before it earns a place in a live strategy, and each one runs in minutes on CoinQuant.
That is the entire purpose of backtesting an OBV strategy on Bitcoin before trading it: you see the 9-trade losing streak on a spreadsheet instead of in your account. The volume family on CoinQuant now covers OBV, MFI, and volume surge, so the full picture of volume-confirmed trading is testable side by side. See the MFI strategy on Bitcoin and the volume surge strategy on Ethereum for the companion runs.
Disclaimer:
Key Takeaway
