How to Read Backtest Results: Sharpe Ratio, Profit Factor, and Max Drawdown Explained
.png)
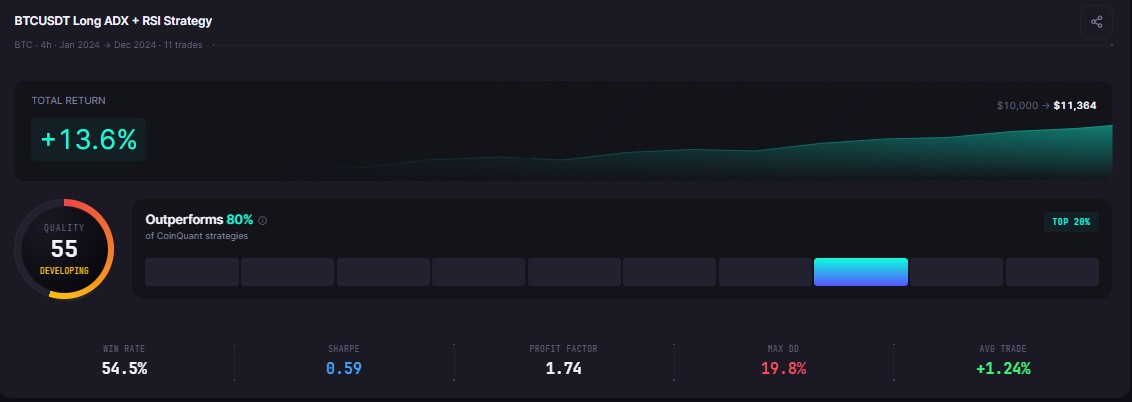
Most traders who run their first backtest stare at the results and reach straight for the total return number. That is the wrong place to start. Knowing how to read crypto backtest results means understanding what each metric measures, how they interact, and what combinations signal a strategy worth developing further versus one that looks good on paper but will fall apart under real conditions. This guide covers the six most important outputs CoinQuant returns, what each tells you, and how to evaluate them together.
The Six Metrics That Actually Matter
CoinQuant returns 17 metrics per backtest, including CAGR, Volatility, Calmar Ratio, Payoff Ratio, and per-trade averages. For traders evaluating a strategy for the first time, six of these carry the most weight. Understanding these six creates the foundation for reading any result set accurately.
The metrics are: Total Return, Sharpe Ratio, Profit Factor, Max Drawdown, Win Rate, and Total Trades. Each measures something different. None of them alone is sufficient to evaluate a strategy. The combination tells the full story.
Total Return
Total return is the percentage gain or loss over the backtest period. It is the most visible number and the least useful metric in isolation.
A strategy with a 200% return over three years is impressive until you discover the max drawdown was 65%. That means at some point during the test, your portfolio was down 65% from its peak. Most real traders do not hold through a 65% drawdown. They exit. What looks like a 200% total return on paper may be a strategy that is impossible to follow in practice.
Use total return as a starting point, not a conclusion.
Sharpe Ratio
The Sharpe Ratio measures risk-adjusted return: how much return the strategy generated per unit of volatility it absorbed. A Sharpe above 1.0 is generally considered acceptable. Above 1.5 is solid. Above two is strong.
A negative Sharpe ratio means the strategy lost more in risk-adjusted terms than a risk-free investment would have returned. A Sharpe below zero is a clear disqualifier: you are taking on volatility with no reward for it.
The Sharpe ratio is more useful than total return because it penalises strategies that achieve gains through high volatility. Two strategies with the same total return but different Sharpe ratios are not equivalent: the one with a higher Sharpe achieved its return more efficiently.
Profit Factor
Profit Factor is gross profits divided by gross losses. A value above 1.0 means the strategy made more than it lost in aggregate. A Profit Factor of 1.5 means for every $1 lost, the strategy generated $1.50 in profit. Below 1.0 means the strategy lost money overall.
Values above 1.5 indicate a meaningfully positive edge. Values between 1.0 and 1.3 suggest a thin edge that transaction costs, slippage, and execution variance may erode in live trading.
Max Drawdown
Max Drawdown is the largest peak-to-trough decline during the backtest period. It tells you the worst case experience a holder of that strategy would have faced.
A 30% max drawdown means at some point you would have been watching your account sit 30% below its recent high. Your risk tolerance, position size, and whether you can psychologically hold through that determines whether that is acceptable for you.
Win Rate and Total Trades
Win rate is the percentage of trades that closed profitable. It sounds intuitive but is often misleading.
A 70% win rate with a Profit Factor of 0.8 means the strategy wins often but loses large. A 40% win rate with a Profit Factor of two means the opposite: fewer wins, but winners are significantly larger than losers.
Total trades is a sample size indicator. A 90% win rate across six trades is not statistically meaningful. A 60% win rate across 200 trades carries real weight. Evaluate both metrics in the context of the trade count that produced them.
How Metrics Interact: What to Look For
The most reliable backtest profile combines a positive Sharpe Ratio (above 1.0), a Profit Factor above 1.5, a max drawdown within a range you could realistically hold through, and a trade count large enough to be statistically meaningful.
A strategy with a high win rate but a low Profit Factor is relying on many small wins and a few large losses. In live trading, that few large losses scenario tends to arrive at the worst possible moment: during volatility spikes, when spreads widen and slippage increases.
A strategy with a high Sharpe Ratio and moderate total return is often more deployable than one with a high total return and a low Sharpe. The goal is not to find the highest historical return. It is to find a strategy whose logic is consistent and whose risk profile you can actually follow.
A Plain-English Example
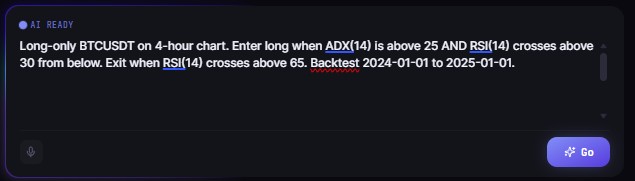
Here is a strategy you could type into CoinQuant's AI builder:
"Buy BTCUSDT on the daily chart when RSI(14) drops below 35 and then closes back above 35. Sell when RSI crosses above 65. Use Kaiko data from 2019 to 2024."
CoinQuant will parse this, build the strategy logic, and return a full metric set in seconds. When you read the result, start with the Sharpe Ratio. If it is below zero, the strategy failed to generate risk-adjusted return: stop there. If it is above 1.0, move to Max Drawdown. If the drawdown is within your tolerance, check Profit Factor. Only then look at Total Return as a context figure.
Common Mistakes When Reading Backtest Results
Optimising for total return. The backtest that returns the highest total return is usually the most curve-fitted. Varying one parameter at a time and checking that results stay stable across changes is a more reliable test of strategy quality than finding the configuration that maximised historical performance.
Ignoring sample size. A perfect win rate across five trades is not a validated strategy. It is a five-trade sample. Strategies need enough trades to produce statistically meaningful patterns: aim for at least 30-50 trades before drawing conclusions.
Treating a single market regime as the whole story. A strategy backtested only during a bull run may show excellent metrics. The same strategy backtested through the 2022 bear market may fail completely. Run backtests across multiple market conditions: bull phases, bear phases, and sideways consolidation periods.
Ignoring fees. CoinQuant models transaction costs at 0.1% per trade by default. Many traders run mental backtests assuming zero fees, then discover that fee drag materially changes the result, especially for strategies with high trade counts.
Disclaimer:
This content is for educational and informational purposes only and does not constitute financial, investment, or trading advice. All strategies and examples are for illustrative purposes and do not guarantee results. Always conduct your own research before making financial decisions.
Key Takeaway