
Golden Cross Strategy Backtest on Ethereum: Did the 50/200 Day SMA Cross Beat Buy and Hold? (2021-2026)

This golden cross strategy backtest asks one question: did buying Ethereum when the 50-day SMA crossed above the 200-day SMA, and selling on the death cross, beat simply holding ETH? From August 2021 to August 2026 it did, but only by losing less. The rule finished at -10.83% after five trades, while ETH buy and hold lost 27.95%.
Five trades in five years is a story, not a statistical verdict. Three of the five golden crosses made money, yet the two losing trades together cost more than the three winners made: the August 2021 signal lost 15.69% after fees and the December 2024 signal lost 41.58%. The strategy also sat through a 61.46% Max Drawdown along the way.
This article builds the textbook 50/200 day SMA crossover in CoinQuant, tests it on five years of daily ETHUSDT data with a 0.1% fee on every fill, walks through every trade and reports the results without adjustment. No tuned parameters, no cherry-picked dates.
What the Golden Cross Is and Why Traders Trust It
A golden cross happens when a short moving average crosses above a long one. The classic version uses the 50-day simple moving average (SMA) and the 200-day SMA on a daily chart. The mirror image, the 50-day crossing back below the 200-day, is the death cross. It is the usual exit.
- Entry signal: the 50-day SMA crosses above the 200-day SMA (the golden cross)
- Exit signal: the 50-day SMA crosses below the 200-day SMA (the death cross exit)
- The goal: hold through long uptrends and sit in cash through long downtrends
Traders trust it because it is simple, visible on any chart and slow enough to ignore day-to-day noise. It is one of the best-known named rules in crypto trading, which is why the most popular crypto trading strategy of 2026 and the best crypto trading strategy for beginners both test a version of it on Bitcoin.
The catch is frequency. Because both averages move slowly, the 50/200 SMA crossover fires rarely: on daily ETH it produced only five trades in five years, about one a year. That small sample shapes everything that follows.
The Exact Rules We Tested
The strategy is saved in the author's CoinQuant library as ETH SMA 50/200 Golden Cross 1D 2021-2026. It was described in plain English, with no coding required, for example: "Buy ETHUSDT on the daily chart when the 50-day SMA of the close crosses above the 200-day SMA. Sell when it crosses back below." The settings below are exactly as stored.
| Parameter | Setting |
|---|---|
| Strategy | ETH SMA 50/200 Golden Cross 1D 2021-2026 |
| Instrument | ETHUSDT (spot, Binance) |
| Data source | Kaiko via CoinQuant |
| Timeframe | Daily (1D) |
| Tested window | 2021-08-01 to 2026-08-01 |
| First trade to last exit | 2021-08-08 to 2025-11-30 (no position open at the end of the test) |
| Entry | SMA(50, Close) crosses above SMA(200, Close), market order |
| Exit | SMA(50, Close) crosses below SMA(200, Close), market order |
| Direction | Long only, one position at a time, no leverage |
| Initial capital | $10,000 |
| Position size | 100% of equity per entry |
| Fees | 0.1% taker on entry and 0.1% on exit, modelled on every fill (no slippage set) |
| Baselines (same window) | ETH Buy and Hold 1D 2021-2026; BTC Buy and Hold 1D 2021-2026 |
In the CoinQuant builder, the whole strategy is two conditions: one entry cross and one exit cross on daily ETHUSDT. There is no stop loss, no take profit and no extra filter.
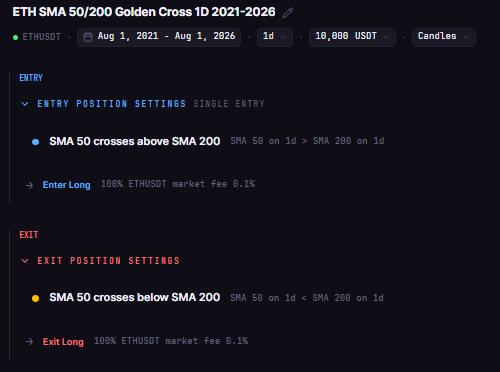
ETH SMA 50/200 Golden Cross 1D 2021-2026 in the CoinQuant builder: enter when the 50-day SMA crosses above the 200-day SMA, exit when it crosses back below, on daily ETHUSDT.
Five Trades in Five Years: Every Signal on the Chart
Every trade is listed below with its return after the 0.1% entry and exit fees. Dates are the fill dates reported by the backtest.
| Trade | Entry | Exit | Days held | Return after fees | Net P&L after fees |
|---|---|---|---|---|---|
| 1 | 2021-08-08 | 2022-01-28 | 173 | -15.69% | -$1,566.96 |
| 2 | 2023-02-09 | 2023-09-01 | 204 | +5.22% | +$439.37 |
| 3 | 2023-11-21 | 2024-08-08 | 261 | +38.53% | +$3,415.52 |
| 4 | 2024-12-05 | 2025-03-01 | 86 | -41.58% | -$5,103.98 |
| 5 | 2025-07-01 | 2025-11-30 | 152 | +24.15% | +$1,733.32 |
The first cross bought late in a strong run
The first golden cross filled on 2021-08-08 with ETH at $3,011.85. The death cross did not arrive until 2022-01-28, and by then the trade was down 15.69% after fees. This is the classic complaint about the golden cross: it buys late and sells late.
Two winners in the 2023 to 2024 recovery
The next two signals caught the recovery. A small 5.22% gain in 2023 was followed by the best trade of the test, bought on 2023-11-21 and sold on 2024-08-08 for 38.53% after fees, or $3,415.52.
The late signal that did the most damage
The fourth golden cross filled on 2024-12-05 at $3,785.20. ETH then fell hard, and by the time the death cross confirmed on 2025-03-01 the price move was -41.42%. After fees the trade lost 41.58%, or $5,103.98, more than any single winner made.
The final signal, on 2025-07-01, recovered part of that with a 24.15% gain after fees before the death cross closed it on 2025-11-30. No new golden cross fired before the test ended.
This is how a 60.00% Win Rate can sit next to a Profit Factor of 0.84. The average winning trade made $1,862.74 and the average losing trade lost $3,335.47, so the two losers together cost more than the three winners earned. Remove either loss on its own and the total would have finished positive.
Golden Cross Strategy Backtest Results vs ETH Buy and Hold
Over the full window, the golden cross turned $10,000 into $8,917.28, a Total Return of -10.83%. Holding ETH turned the same $10,000 into $7,205.03 (-27.95%), and holding Bitcoin finished at $15,733.43 (+57.33%).
| Metric | Golden cross | ETH buy and hold | BTC Spot Comparison |
|---|---|---|---|
| Strategy | ETH SMA 50/200 Golden Cross 1D 2021-2026 | ETH Buy and Hold 1D 2021-2026 | BTC Buy and Hold 1D 2021-2026 |
| Total Return | -10.83% | -27.95% | +57.33% |
| Final Balance | $8,917.28 | $7,205.03 | $15,733.43 |
| Total Trades | 5 | 1 | 1 |
| Win Rate | 60.00% (3W / 2L) | n/a (single hold) | n/a (single hold) |
| Profit Factor | 0.84 | n/a | n/a |
| Sharpe Ratio | 0.18 | 0.26 | 0.44 |
| Max Drawdown | 61.46% | 79.30% | 76.63% |
| CAGR | -2.26% | -6.34% | +9.48% |
| Time in Market | 47.95% | 100.00% | 100.00% |
| Total Fees | $92.47 | $17.20 | $25.74 |
All three runs share the same window, capital, sizing and 0.1% fee, so the rows compare like with like. Win Rate and Profit Factor are not shown for buy and hold because each benchmark is a single trade.
The headline is mixed. The golden cross lost less than holding ETH and had a shallower Max Drawdown (61.46% against 79.30%), while sitting in cash for just over half the window. But its Sharpe Ratio of 0.18 was below ETH buy and hold (0.26), and it trailed Bitcoin by a wide margin.
On the Performance tab, the results card marks this run "Statistically inconclusive": five trades, and it needs 50+ to rate. The platform's Buy and Hold benchmark carries no fees and ends at -27.81%, so the table uses the ETH Buy and Hold 1D 2021-2026 strategy (-27.95%), which pays the 0.1% fee on entry and exit.
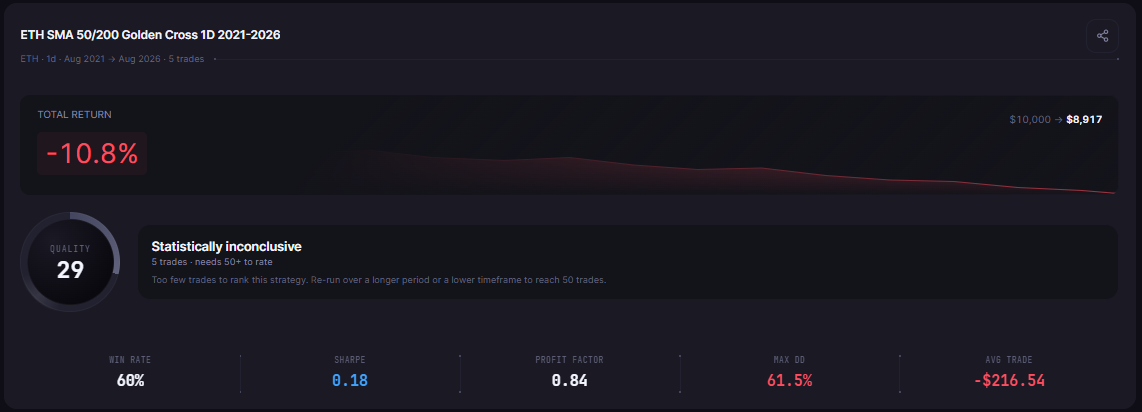
ETH SMA 50/200 Golden Cross 1D 2021-2026 results card on the Performance tab, daily ETHUSDT, 2021-08-01 to 2026-08-01: Total Return -10.83%, Max Drawdown 61.46%, Profit Factor 0.84, Win Rate 60.00% and Sharpe Ratio 0.18 over five trades, marked Statistically inconclusive.
What This Test Cannot Tell You
Five trades cannot prove an edge. With a sample this small, two signals shaped the outcome: the December 2024 loss of $5,103.98 was larger than the best winner, and only the two losses together pushed the total below zero. The guide on how to know if your trading strategy is overfit explains why a handful of trades should never be trusted on its own.
- Sample size: five trades, about one a year, so every metric rests on very few data points.
- One asset, one window: daily ETHUSDT from 2021-08-01 to 2026-08-01. Another coin or start date could give a different answer.
- Settings: this is the textbook 50/200 SMA pair. Faster pairs behave differently, as EMA 20/50 vs EMA 50/200 on Bitcoin and EMA 20/50 vs SMA 200 on Bitcoin show.
- Costs: the 0.1% fee on entry and exit is included, but slippage was not modelled, so real fills could be slightly worse.
- No forecast: past results do not predict future returns.
The Practical Lesson
- It lost less than holding ETH: -10.83% against -27.95%, with a Max Drawdown of 61.46% against 79.30%.
- It still lost money: and it finished far behind holding Bitcoin (+57.33%).
- Win Rate can mislead: three winners out of five (60.00%) still produced a Profit Factor of 0.84.
- It is slow by design: five trades in five years means late entries and late exits.
Treat the golden cross as a slow trend filter, not a complete crypto trading strategy. In CoinQuant, an AI trading platform, you can run the same rule on your own coin and window, add a second condition such as a momentum filter (CoinQuant supports multi-indicator and multi-timeframe conditions) or compare it with a faster crossover. Each change needs its own backtest before it earns any trust.
Build trading strategies on real data. No coding required.
Frequently Asked Questions
Does the golden cross strategy work on Ethereum?
Not on its own in this test. On daily ETHUSDT from 2021-08-01 to 2026-08-01, the 50/200 SMA golden cross returned -10.83% after fees over five trades. That beat ETH buy and hold (-27.95%) but still lost money.
How often does a golden cross happen on the daily chart?
Rarely. The 50/200 day SMA rule entered only five times on ETH in five years, about once a year. Each position was then held for months.
Is the golden cross better than just holding ETH?
Over this window it lost less (-10.83% against -27.95%) and had a shallower Max Drawdown (61.46% against 79.30%). Its Sharpe Ratio was lower (0.18 against 0.26), and with only five trades the gap rests on the timing of very few signals.
Test the golden cross on your own coin and window before you trust it.
Disclaimer:
Key Takeaway