
EMA 20/50 vs SMA 200 on Bitcoin: Which Trend Strategy Backtests Better? (1D, 2021-2026)

The moving average is the most used indicator in trading, and the settings debate never ends. Fast traders swear by short exponential crosses, patient traders swear by the 200-day simple average. Both camps are describing the same goal, catching Bitcoin's trends, with different assumptions about how quickly trends should be trusted.
This article settles the settings question with data: the EMA 20/50 crossover versus the SMA 200 trend filter, both on daily Bitcoin, both across the same window from January 2021 to August 2026. The fast system and the slow system both made money, and the difference between them is more revealing than the returns alone.
The Two Strategies
BTC EMA Crossover 20/50 1D 2021-2026
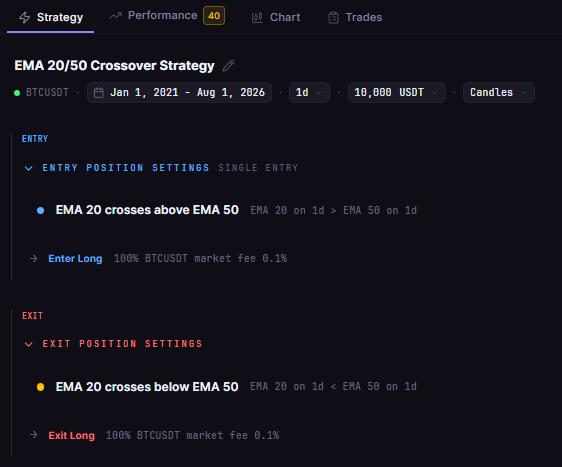
The fast system uses two exponential moving averages:
Entry: EMA(20) crosses above EMA(50)
Exit: EMA(20) crosses below EMA(50)
Exponential averages weight recent price more heavily, so this system reacts quickly to trend changes. It is designed to enter early in a move and leave early when the move stalls.
BTC Trend Following 1D 2021-2026
The slow system uses the classic long-term filter:
Entry: close above the 200-day simple moving average (SMA 200)
Exit: close below the SMA 200
The simple average weights all days equally, and 200 days is long enough that only major regime shifts trigger trades. This system is designed to stay in Bitcoin during sustained bull phases and step aside during bear phases, accepting late entries and late exits in exchange for fewer false signals.
Test Setup
| Parameter | EMA 20/50 Crossover | SMA 200 Trend Following |
|---|---|---|
| Strategy (library names) | BTC EMA Crossover 20/50 1D 2021-2026 | BTC Trend Following 1D 2021-2026 |
| Instrument | BTCUSDT (spot, Binance) | BTCUSDT (spot, Binance) |
| Timeframe | Daily (1D) | Daily (1D) |
| Tested window | 2021-01-01 to 2026-08-01 | 2021-01-01 to 2026-08-01 |
| Entry | EMA(20) crosses above EMA(50) | Close above SMA(200) |
| Exit | EMA(20) crosses below EMA(50) | Close below SMA(200) |
| Direction | Long only, no leverage | Long only, no leverage |
| Initial capital | $10,000 | $10,000 |
| Position size | 100% of equity per entry | 100% of equity per entry |
| Fees | 0.1% taker, modeled | 0.1% taker, modeled |
| Data source | Kaiko via CoinQuant | Kaiko via CoinQuant |

The Backtest Results
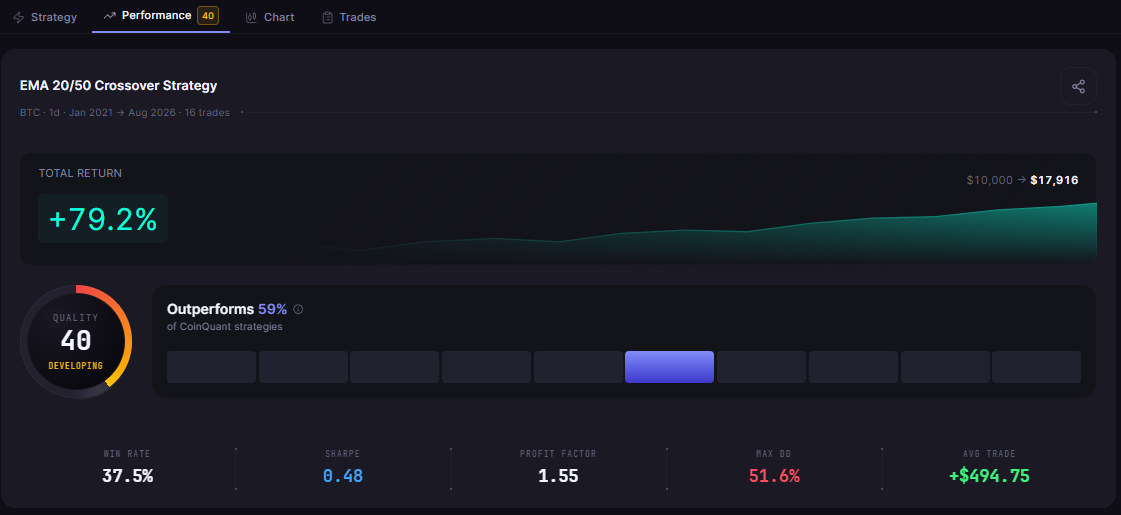
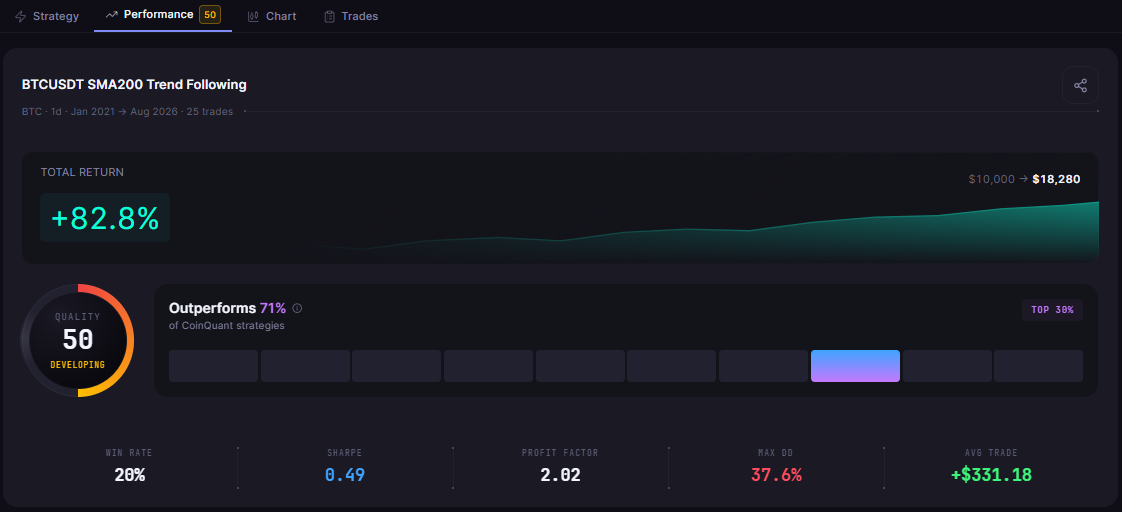
The reported total returns differ by 3.61 percentage points (82.74% versus 79.13%). The resemblance ends there.
| Metric | EMA 20/50 Crossover | SMA 200 Trend Following |
|---|---|---|
| Total Return | +79.13% | +82.74% |
| Final Balance | $17,913.35 | $18,273.54 |
| Total Trades | 16 | 25 |
| Win Rate | 37.5% (6W / 10L) | 20.0% (5W / 20L) |
| Profit Factor | 1.55 | 2.02 |
| Sharpe Ratio | 0.48 | 0.49 |
| Sortino Ratio | 0.70 | 0.73 |
| Max Drawdown | 51.58% | 37.60% |
| Average Win | $3,731.55 | $3,272.86 |
| Average Loss | $1,447.59 | $404.54 |
| Best Trade | +$8,930.42 | +$8,159.20 |
| Worst Trade | -$2,999.12 | -$825.14 |
| Time in Market | 46.20% | 47.77% |
| Total Fees | $458.58 | $654.05 |
What the Data Shows
The headline is the drawdown gap. The EMA system drew down 51.58% at its worst, the SMA 200 system only 37.60%, yet the SMA system still returned slightly more, +82.74% versus +79.13%. The slow system produced a better result with a much smoother ride, which is exactly what its design promises.
The mechanism is in the trade-level numbers. The EMA crossover took 16 trades and lost on 10 of them, with an average loss of $1,447.59. The SMA 200 system took 25 trades and lost on 20, but its average loss was only $404.54. The slow filter's losses were a quarter the size, because it only exited when the whole 200-day regime had flipped, not on short-term noise.
The Win Rate Paradox
The SMA 200 system won only 20% of its trades and still made more money than the EMA system with a 37.5% win rate. That is the payoff ratio doing the work: the trend follower's average win of $3,272.86 was 8.1 times its average loss of $404.54. The EMA system's payoff ratio was 2.6.
This is the classic trend-following profile at its cleanest. A 20% win rate with an 8.1 payoff ratio is a fully functional strategy, and it is the reason the slow system felt less stressful: the losses were small and frequent, the wins large and rare. The EMA system's losses were bigger because it exited on the fast cross, which fires on noise as well as on real trend changes.
The Fee Story
The SMA 200 system paid more in fees, $654.05 versus $458.58, despite similar time in market, because its 25 round trips cost more than the EMA system's 16. Even so, it outearned the fast system after costs. The fee difference is a reminder that trade count is a cost driver, but the SMA 200's structural advantage, small losses, swamped the extra fees.
The Practical Lesson
The settings debate has a data answer: over 2021-2026, the slow system matched the fast system's return with 14 points less drawdown
Win rate is not the point: 20% wins with an 8.1 payoff ratio beat 37.5% wins with a 2.6 payoff ratio
Loss size is the hidden variable: the SMA 200 filter cut the average loss to $404.54, a quarter of the EMA system's $1,447.59
Fees favor fewer trades, but not enough to close the gap: the trend follower outearned the crossover after paying $195 more in costs
The EMA versus SMA question is really a risk question. If you can hold through a 51.58% drawdown, the fast crossover is fine. If you want the same return with a materially smoother equity curve, the 200-day filter is the better answer. The backtest makes the tradeoff explicit, and the choice becomes yours with the numbers in front of you.
Run these two moving average strategies yourself and test your own settings on CoinQuant. Run this EMA vs SMA backtest free on CoinQuant
Disclaimer:
Key Takeaway