
EMA 20/50 vs EMA 50/200 on Bitcoin: Which Crossover Settings Backtest Better?
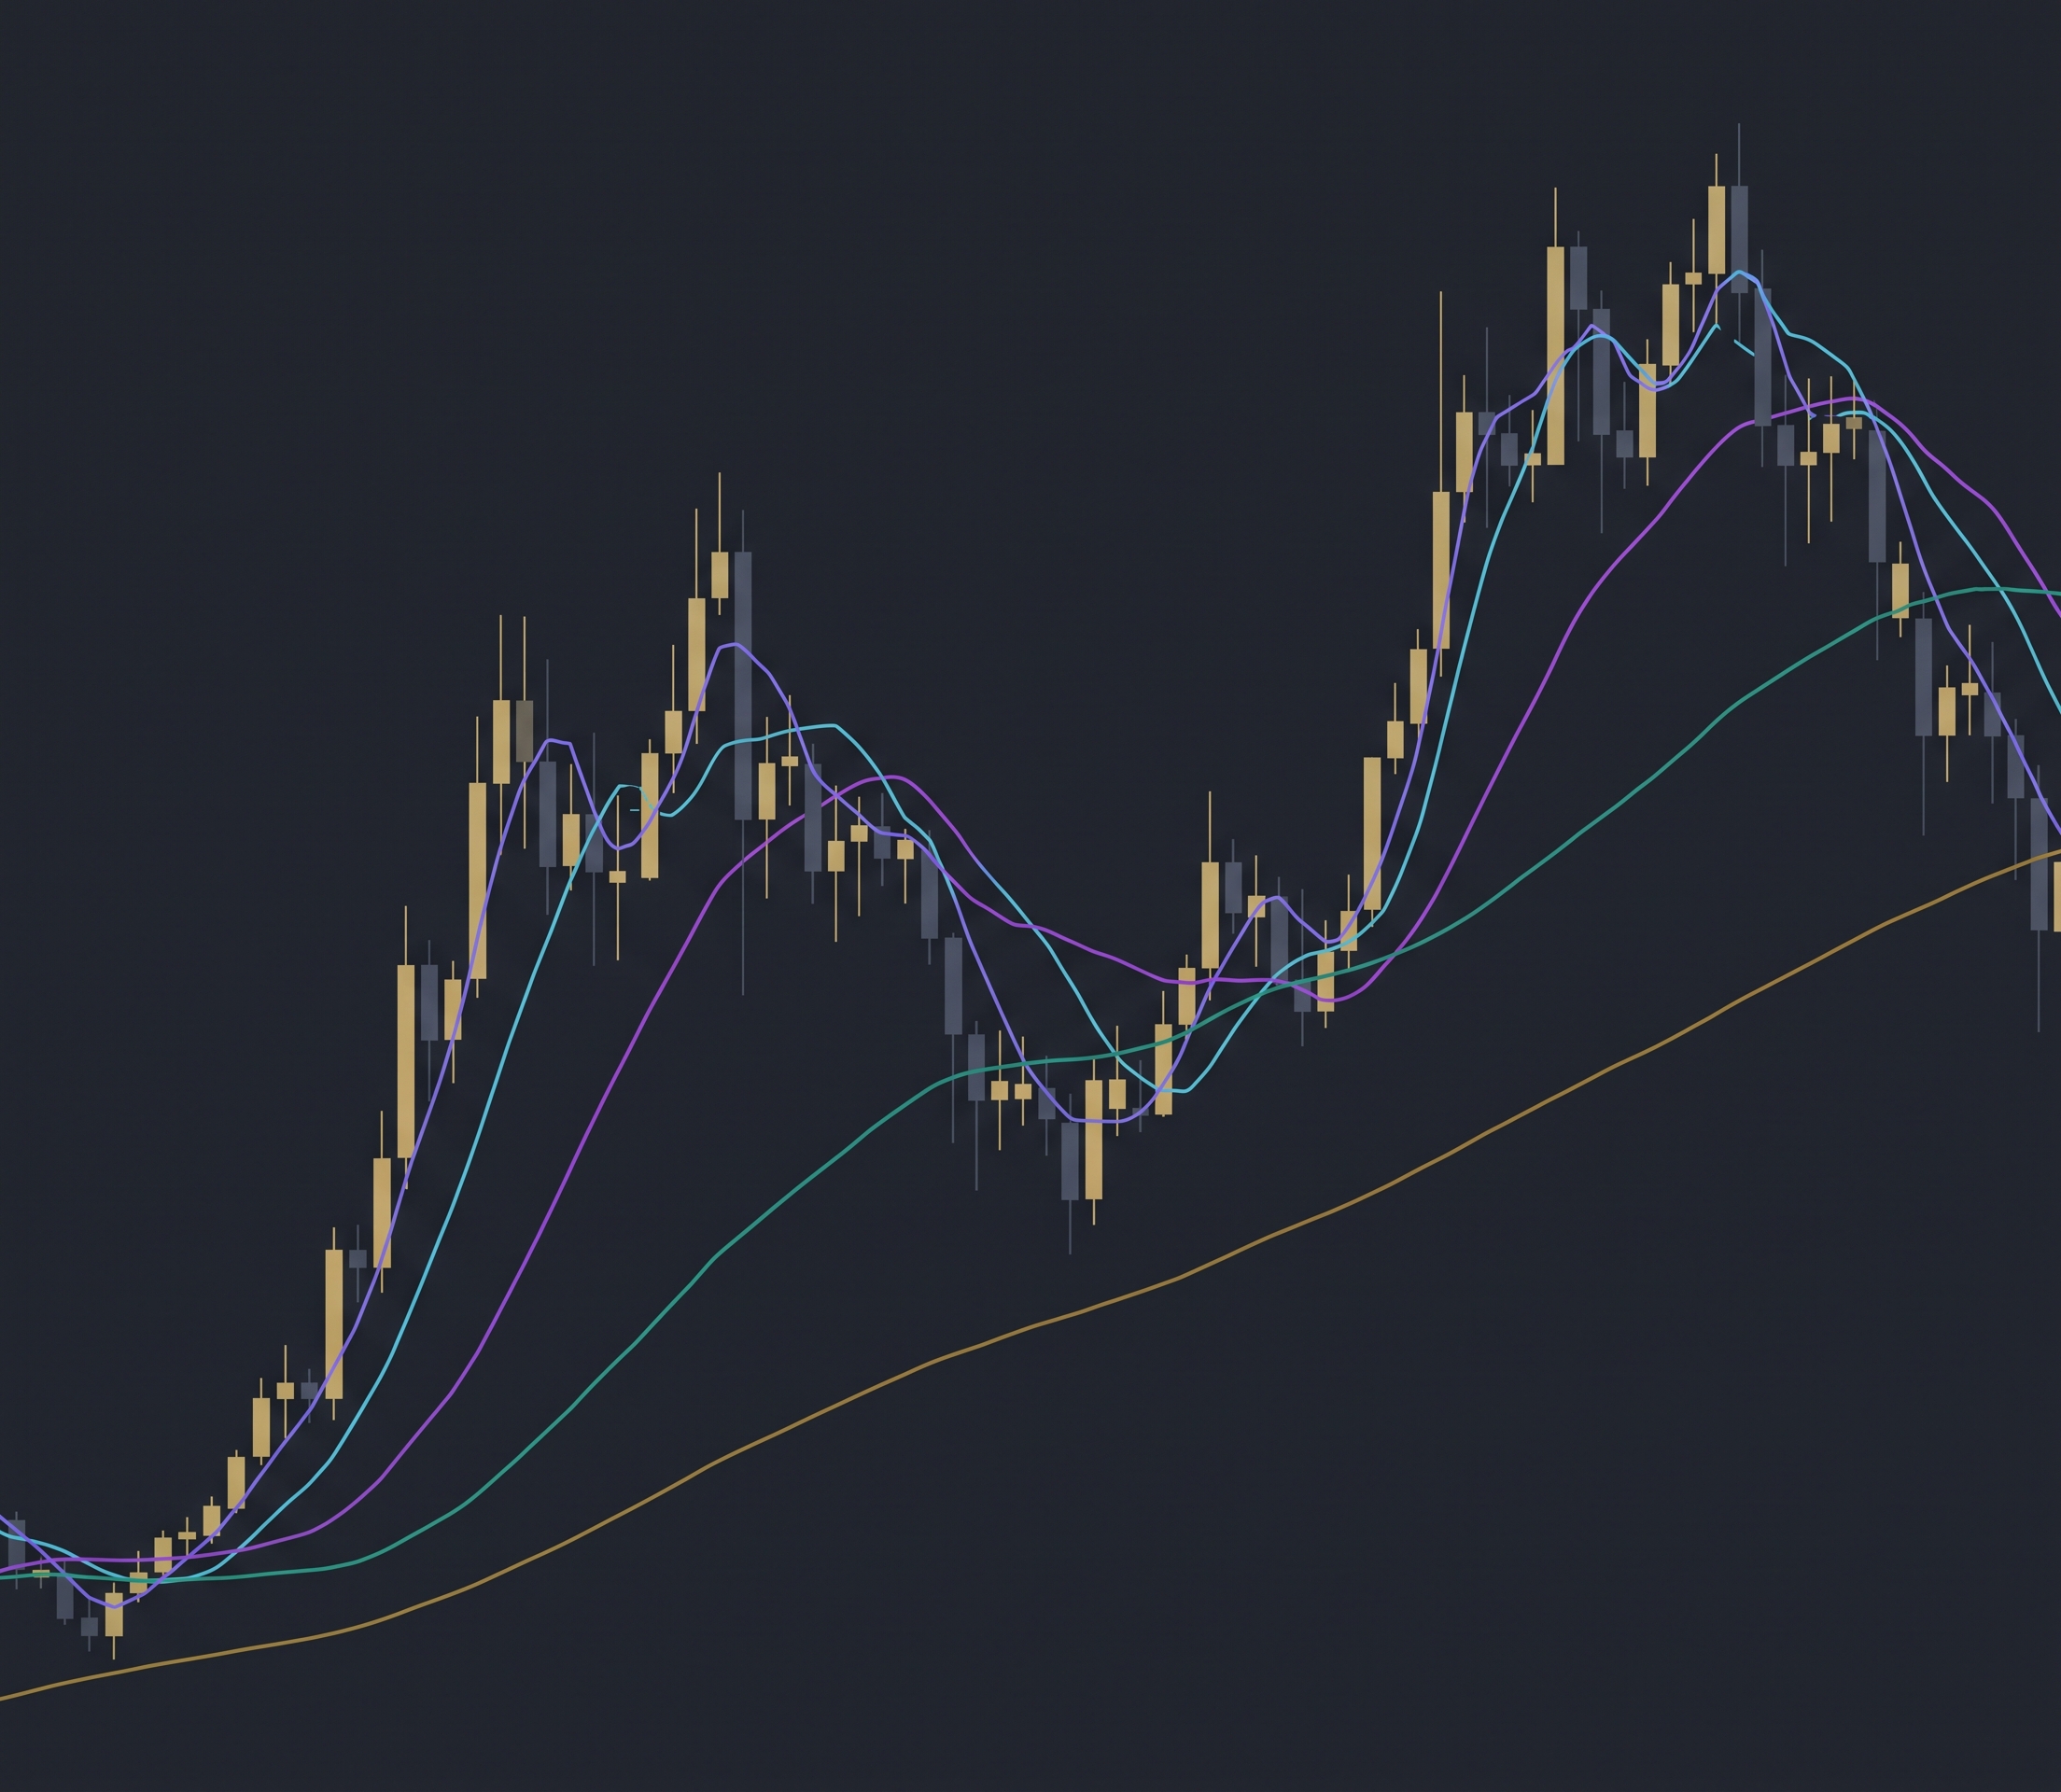
The exponential moving average crossover is the most common strategy in crypto, and the most common settings question is which period pair to use. Fast pairs like EMA 20/50 react quickly and trade often. Slow pairs like EMA 50/200 react late and trade rarely, but each trade carries more.
This article answers the settings question with two tested library strategies on daily Bitcoin over the same 5.6-year window, January 2021 to August 2026: BTC EMA Crossover 20/50 1D 2021-2026 and AI EMA 50/200 1D Trend Strategy. Both are long-only crossover systems with 100% position sizing and modeled fees.
The short version of the result: the slow pair earned more, +216.65% versus +79.16%, and the fast pair was the more robust strategy. Which one is "better" depends entirely on which weakness you can tolerate.
What Each Settings Pair Does
EMA 20/50: the fast configuration. The 20-period EMA crossing the 50-period EMA catches trend changes quickly, which means earlier entries and more whipsaws
EMA 50/200: the slow configuration. The 50-period EMA crossing the 200-period EMA only fires on major trend shifts, which means few trades and long holds
Both pairs generate the same signal shape: buy when the fast line crosses above the slow line, sell when it crosses back below. Only the speed of the lines differs.
Test Setup
| Parameter | Setting |
|---|---|
| Strategy (library names) | BTC EMA Crossover 20/50 1D 2021-2026 and AI EMA 50/200 1D Trend Strategy |
| Instrument | BTCUSDT (spot, Binance) |
| Timeframe | Daily (1D) |
| Tested window | 2021-01-01 to 2026-08-01 (5.6 years) |
| Rules | EMA fast crosses above EMA slow to enter, crosses below to exit |
| Direction | Long only, no leverage |
| Initial capital | $10,000 |
| Position size | 100% of equity per entry |
| Fees | 0.1% taker, modeled on every trade |
| Data source | Kaiko via CoinQuant |
The Backtest Results
| Metric | EMA 20/50 (fast) | EMA 50/200 (slow) |
|---|---|---|
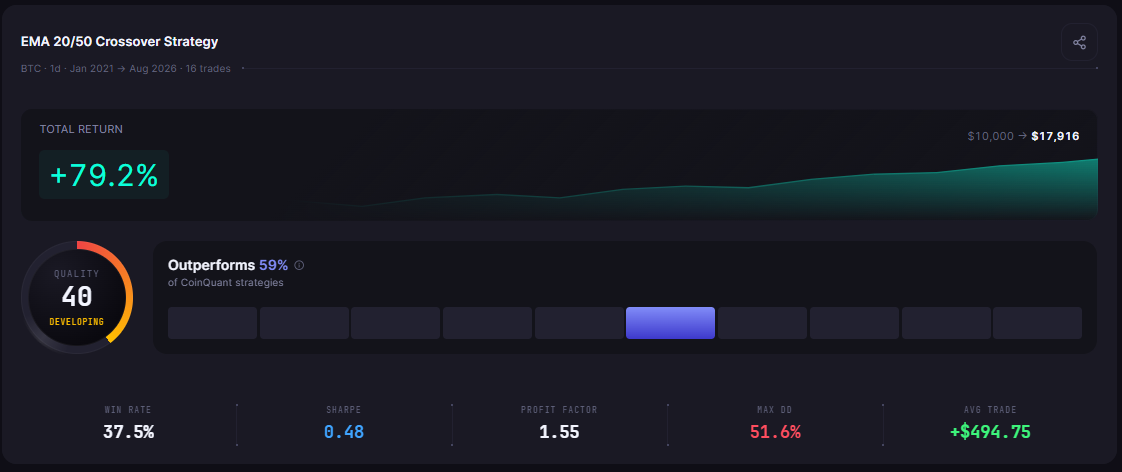
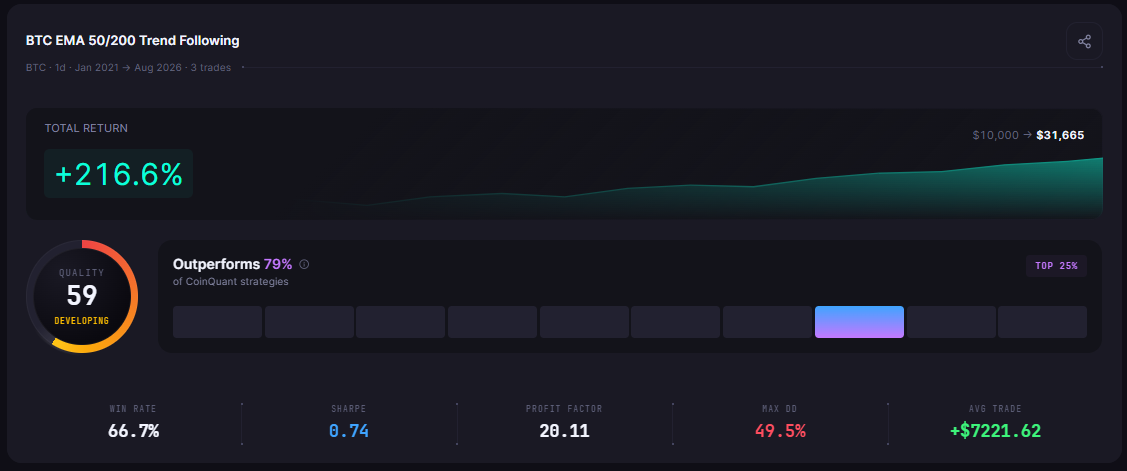
| Total Return | +79.16% | +216.65% |
| Final Balance | $17,916.00 | $31,664.87 |
| Total Trades | 16 | 3 |
| Win Rate | 37.5% (6W / 10L) | 66.7% (2W / 1L) |
| Profit Factor | 1.55 | 20.11 |
| Sharpe Ratio | 0.48 | 0.74 |
| Sortino Ratio | 0.70 | 1.13 |
| Max Drawdown | 51.62% | 49.46% |
| Average Win | $3,734.76 | $11,399.23 |
| Average Loss | $1,449.26 | $1,133.59 |
| Best Trade | +$8,936.67 | +$22,234.93 |
| Worst Trade | -$3,002.65 | -$1,133.59 |
| Time in Market | 46.20% | 56.06% |
| Total Fees | $459.09 | $78.34 |
The Fast Pair: Consistent but Rough
The 20/50 crossover traded 16 times in 5.6 years and won only 37.5% of them, which is normal for trend following. It made money because its average win of $3,734.76 was 2.6 times its average loss of $1,449.26. The year-by-year path shows the profile: a loss of $4,389 in 2022, then $1,353 in 2023, $5,220 in 2024 and $6,210 in 2025.
The cost of the fast settings is the 51.62% max drawdown. The 20/50 pair reacts early enough to catch the 2024 trend, and it also reacts early enough to get whipsawed during the 2022 decline and the 2026 range.
The Slow Pair: One Trade Made the Difference
The 50/200 crossover traded three times in the entire window. It lost $1,133.59 in 2022, made $564 in 2023, and then closed a single trade in 2025 worth +$22,234.93. That one trade is 103% of the strategy's total return of +$21,664.87.
The profit factor of 20.11 is real and it is also the product of a three-trade sample. A strategy that needs a once-in-a-cycle trade to deliver its return is not a strategy that can be evaluated on a single backtest, and it is certainly not one to size aggressively after seeing one good result.
What the slow pair does give you is discipline by construction. With three trades in 5.6 years, there is almost nothing to overtrade and almost nothing to second-guess.
Which Settings Are "Best"?
The answer depends on the constraint, and the table below frames it honestly:
| Question | EMA 20/50 (fast) | EMA 50/200 (slow) |
|---|---|---|
| Which earned more over 2021-2026? | +79.16% | +216.65% |
| Which has a larger sample? | 16 trades | 3 trades |
| Which is more robust to a single trade? | Yes | No, one trade is 103% of returns |
| Which draws down less? | 51.62% | 49.46% |
| Which is easier to hold emotionally? | Harder, frequent signals | Easier, rare signals |
| Which is cheaper in fees? | $459.09 | $78.34 |
The 20/50 pair is the more defensible default: 16 trades across two bull legs and two bear phases is a sample you can reason about. The 50/200 pair is the more profitable backtest and the weaker evidence.
The Practical Lesson
The slow pair's headline return hides a three-trade sample. +216.65% from one 2025 trade is a result, not a pattern
The fast pair is the robustness winner. 16 trades across regimes, a 1.55 profit factor, and a return that does not depend on any single trade
Both settings carry near-identical drawdown risk. The crossover family on Bitcoin does not avoid drawdown, it times it
The settings question is a sample-size question. Best ema settings crypto answers need enough trades to mean something, which is exactly what the backtest comparison shows
The next step is to test your own period pairs, 10/30, 30/100, 50/150, on the same data and compare them against these two baselines. That is a few minutes of work on CoinQuant, and it replaces a year of forum opinions.
Compare EMA settings on CoinQuant
Disclaimer:
Key Takeaway