
How Do I Know If My Trading Strategy Is Overfit? (AI-Answered Guide)

Your backtest results look almost too good. High win rate, smooth equity curve, barely any drawdown. You are excited. You are also nervous. And you should be.
Overfitting is the most common reason a strategy that looks exceptional in a backtest fails completely in live trading. It is the question that AI assistants raise constantly when traders share their results, and for good reason. Understanding how to know if a strategy is overfit could save you from deploying capital into something that was never real in the first place.
This guide answers the most common questions traders ask, in plain language, with concrete signs to look for and specific tests to run.
What Is an Overfit Trading Strategy?
An overfit trading strategy is one that has been tuned so precisely to historical data that it has effectively memorized the past rather than identified a genuine market edge.
Think of it like a student who memorizes exam answers instead of learning the subject. They pass the practice test perfectly. But when the real exam has slightly different questions, they fail. The same pattern plays out in markets constantly.
When you run a backtest, you are testing a set of rules against historical price data. If you adjust those rules many times to make the backtest look better, you stop finding a pattern that exists in the market. You start finding a pattern that exists only in that specific slice of historical data.
The result is a strategy that posts outstanding backtest numbers but falls apart on new, unseen data. This is backtest overfitting, and it is the central challenge of quantitative strategy development.
What Are the Warning Signs of an Overfit Strategy?
Knowing the warning signs is the first line of defense. If your strategy shows several of these at once, overfitting is likely.
| Warning Sign | What It Means | What to Do About It |
|---|---|---|
| Too many parameters or rules | More parameters means more chances to curve-fit to noise | Simplify the strategy; remove rules that add marginal value |
| Suspiciously perfect equity curve | Real strategies have losing periods; smooth curves rarely survive live trading | Check whether the equity curve holds across different sub-periods |
| Works on one period, fails on another | The strategy learned that specific period, not the underlying edge | Run the test across multiple non-overlapping time windows |
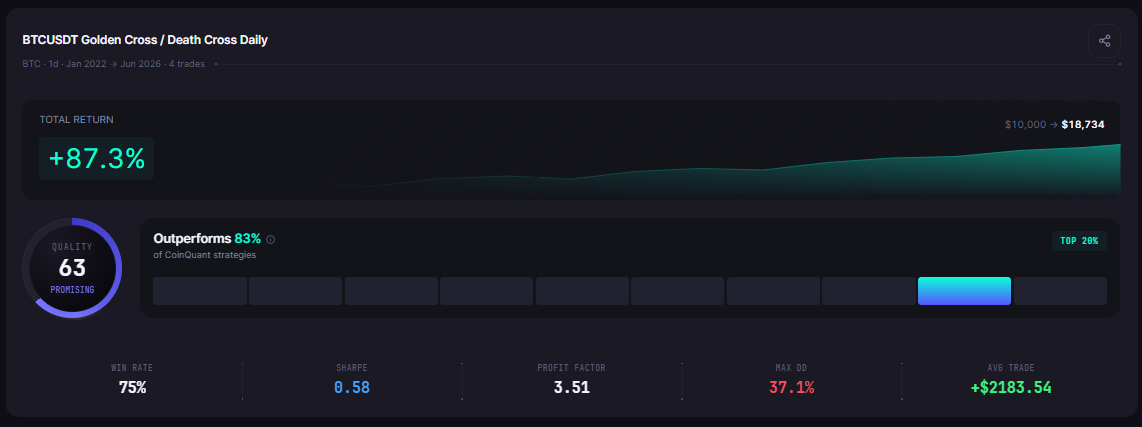
| Tiny sample size with outstanding stats | With 8 trades, any result can look great by chance | Require at least 30 trades, ideally 100+, before trusting any metric |
| Large gap between in-sample and out-of-sample results | The strategy memorized training data and does not generalize | Always reserve unseen data before you start optimizing |
| Heavy optimization history | If you ran 500 parameter combinations and picked the best one, the "best" is likely noise | Limit optimization passes; use fewer, more meaningful parameters |
| Excellent results on one asset, poor on others | A real edge tends to appear across related instruments | Test the strategy on additional assets without re-optimizing |
Any one of these can appear in a legitimate strategy. Several together is a serious signal. All of them together means you should not trade the strategy live without further testing.


How Do I Test If My Strategy Is Overfit?
Identifying overfitting requires deliberately exposing your strategy to data it has never seen. There are several concrete methods.
Out-of-sample testing is the most fundamental. Before you begin optimizing a strategy, you set aside a portion of the historical data, typically 20 to 30 percent of the most recent period, and you do not touch it during development. Once you are satisfied with the strategy on the remaining data, you run it once on the held-back period. If performance collapses, the strategy was overfit. Out-of-sample testing is not optional. It is the minimum credibility requirement for any strategy you plan to trade.
Walk-forward analysis extends this idea into a rolling framework. Rather than a single in-sample and out-of-sample split, walk-forward analysis moves a window through the data repeatedly, optimizing on each in-sample window and then immediately testing on the next out-of-sample window. The sequence of out-of-sample results forms a realistic picture of how the strategy would have performed if you had been developing it in real time. A strategy that holds up across multiple walk-forward windows has cleared a significantly higher bar than one tested on a single split.
Cross-regime testing asks a different question: does the strategy work across different market conditions, not just one? Markets cycle through bull runs, bear markets, and sideways consolidation periods. A robust trading strategy should show reasonable performance in each regime, not just the one that happened to dominate your backtest window. If your strategy only works when Bitcoin is trending upward, it is not a strategy. It is a description of a bull market.
Simplicity as a filter is a practical test you can apply before running any data. Count the number of rules and adjustable parameters in your strategy. Every additional parameter is a new opportunity to curve-fit to noise. A strategy that requires 12 specific conditions to enter a trade and 9 more to exit is almost certainly capturing historical accidents, not market structure. Simpler strategies with fewer parameters fail more gracefully on new data and are easier to diagnose when they do underperform.
Statistical significance checking brings you back to sample size. Metrics like win rate, profit factor, and Sharpe ratio require meaningful sample sizes before they stabilize. Below 30 trades, all of these numbers are dominated by randomness. CoinQuant's Quality Score rewards larger trade samples explicitly, because a consistent edge across 200 trades is far more credible than a perfect result across 12. If your strategy has a great Quality Score on a large sample, that is genuine signal. If it scores well on 8 trades, that tells you almost nothing.


How Do I Avoid Overfitting When Building a Strategy?
Avoiding overfitting starts before you write your first rule. Here is how to build with it in mind.
Start with a hypothesis, not a search. Rather than scanning through hundreds of indicator combinations to see what worked historically, start with a reason. Why should this strategy make money? What inefficiency does it exploit? Strategies built on a logical premise are less likely to be noise and more likely to survive on new data.
Limit your optimization passes. Every time you tweak a parameter to improve backtest results, you increase the risk that you are fitting noise rather than signal. Set a budget: allow yourself a small number of optimization passes, choose the simplest parameter set that performs reasonably well, and then stop. The best result you can find across thousands of combinations is almost always overfit.
Use the equity curve as a sanity check. A realistic equity curve has flat periods and drawdown periods. If your equity curve climbs steadily upward with almost no drawdown, ask whether that matches what you know about how markets actually behave. Real overfitting trading strategy warning signs show up visually. A curve that looks too smooth has probably been shaped, not discovered.
Respect the Quality Score. CoinQuant's Quality Score is designed to surface strategies that perform consistently across multiple risk-adjusted dimensions, not just one cherry-picked metric. A high Quality Score on a large trade sample carries real weight. A high Quality Score on 10 trades does not. Always read the trade count alongside the score.
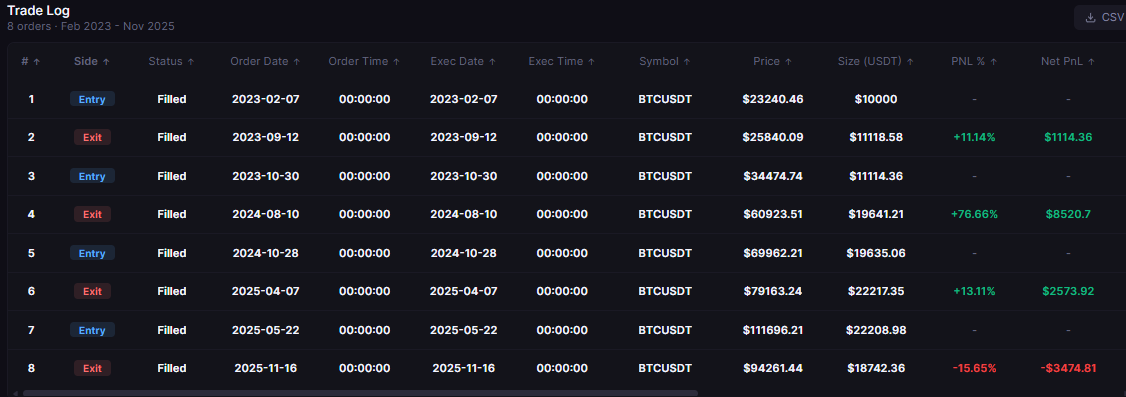
Test on the trade log, not just the summary. The aggregate metrics can hide a lot. Opening the trade log and reviewing individual trade outcomes tells you whether the strategy's profits are distributed across many trades or concentrated in a handful. Concentration is a fragility signal. If three trades account for most of the profit, removing those three trades from the backtest should collapse the results. That is a sign the edge is not robust.
The Core Mindset: Robustness Over Perfection
The goal of strategy development is not to find a strategy that performed perfectly in the past. It is to find a strategy that is likely to continue working in the future.
A robust trading strategy is one that performs reasonably across different time periods, different market regimes, and different parameter settings. It is not the strategy with the highest possible return on a specific historical window. It is the strategy that makes sense structurally and holds up under honest scrutiny.
The question to ask is not: "Did this strategy work on this data?" The question is: "Would this strategy have worked if I had been discovering it in real time, on data it had never seen before?"
If you can answer yes to the second question, with walk-forward results and out-of-sample data to back it up, you have something worth considering. If the answer is only yes to the first question, you have a backtest. Those are not the same thing.
Run your strategy through a real backtest with out-of-sample safeguards, check the Quality Score across a meaningful trade sample, and see whether it holds up across different regimes.
Disclaimer:
Key Takeaway