
The Most Popular Crypto Trading Strategy of 2026 (Backtested)
The most popular crypto trading strategies in 2026 are the same ones that have been popular for years: RSI, moving average crossovers, MACD, and Stochastic oscillator. What changes every year is which ones are working in the current market regime.
This article runs all four of the most commonly used strategies on Bitcoin and compares their verified backtest results side by side. The data covers both long periods (2018-2026) and the more recent 2022-2026 cycle.
Why the "Most Popular" Question Matters
Popularity in trading strategy is a signal, but not the signal many traders think it is. A strategy being popular means many traders are using it, which means large amounts of capital are positioned around its signals. When a strategy generates a widely-watched signal, price often reacts to the signal itself.
That is not a reason to blindly follow popular strategies. It is a reason to understand what they do, verify whether they have worked on real data, and know when they tend to fail.
Strategy 1: RSI Oversold / Overbought
RSI (Relative Strength Index) is the single most searched indicator in crypto. Below 30 is considered oversold; above 70 is considered overbought.
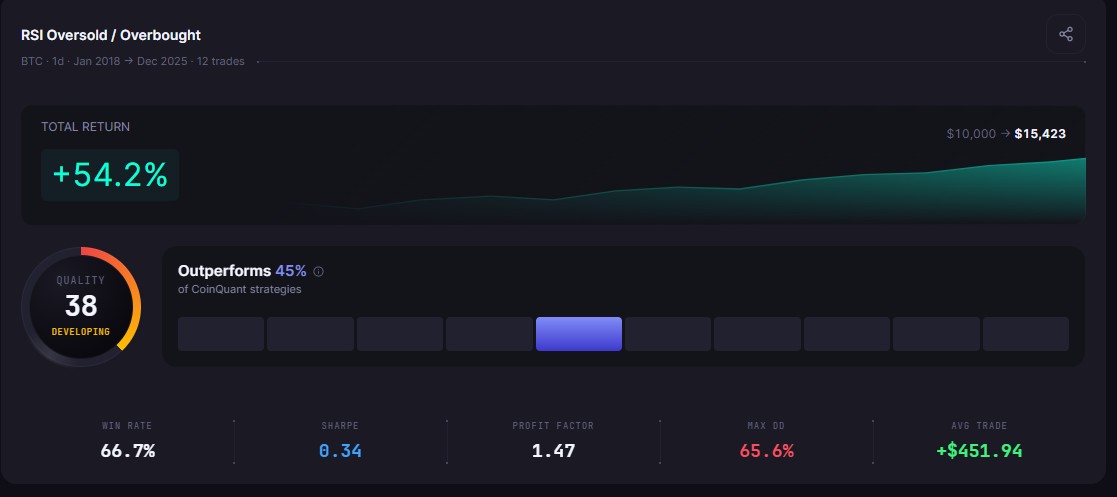
Strategy: RSI (14) buy when crosses above 30, sell when crosses above 70. BTCUSDT daily.
Backtest results (2018-2026, 8 years):
| Metric | Result |
|---|---|
| Total Return | +54.23% |
| Total Trades | 12 |
| Win Rate | 66.7% |
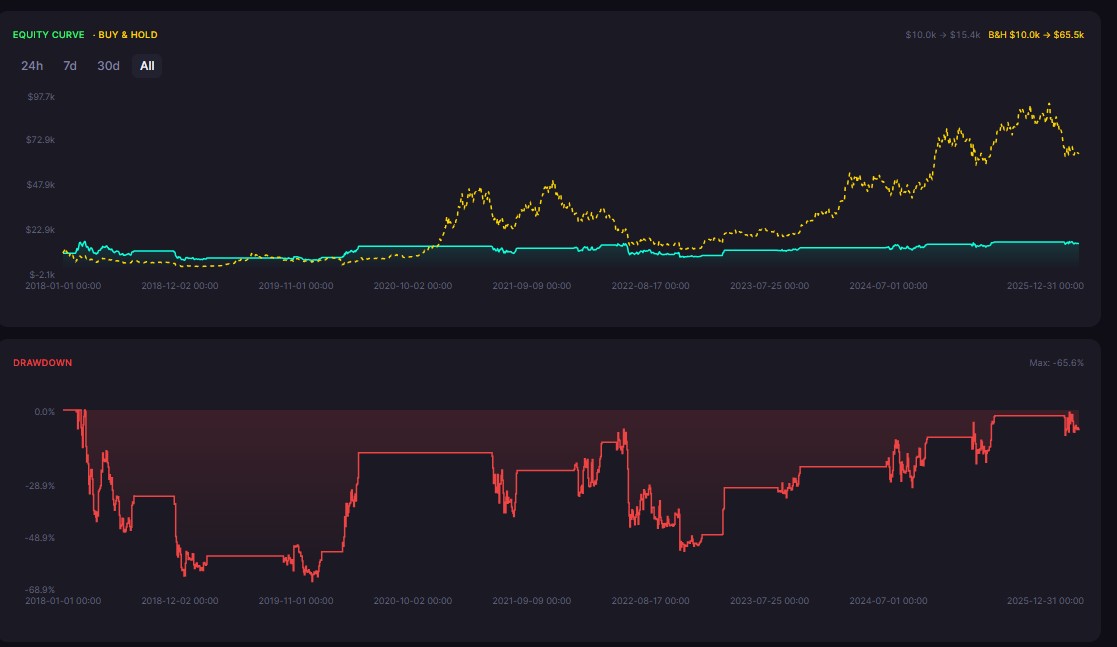
| Max Drawdown | 65.61% |
All backtest data via Kaiko (Binance BTCUSDT spot).
The RSI strategy produced the highest return among strategies tested over the 2018-2026 window: +54.23% across eight years. The 66.7% win rate means two out of every three trades were profitable. The cost was a 65.61% max drawdown. For context, the Golden Cross ran a shorter 2022-2026 window and returned +87.34%, the highest total return in this article.
Strategy 2: Golden Cross / Death Cross
The Golden Cross is the most recognized trend signal in crypto. The 50-day SMA crossing above the 200-day generates a buy signal. The reverse (Death Cross) generates an exit.
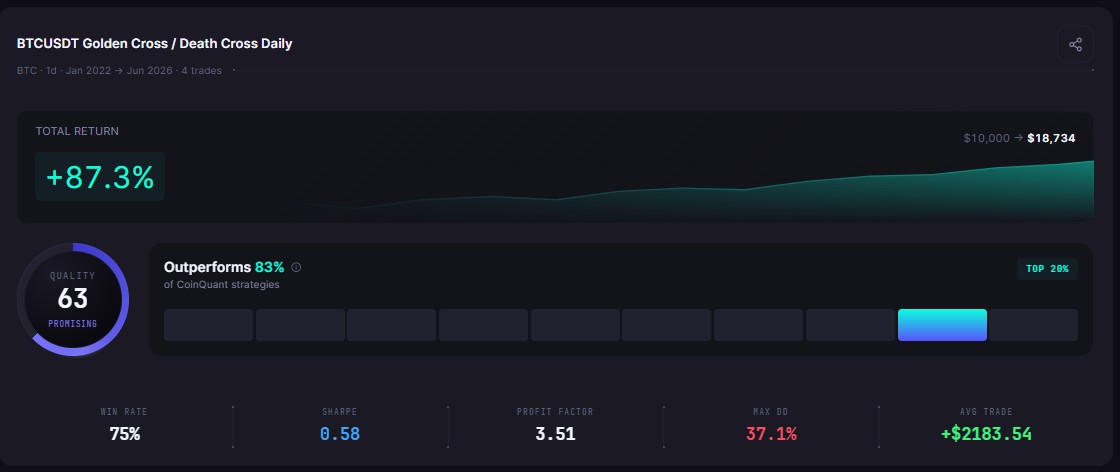
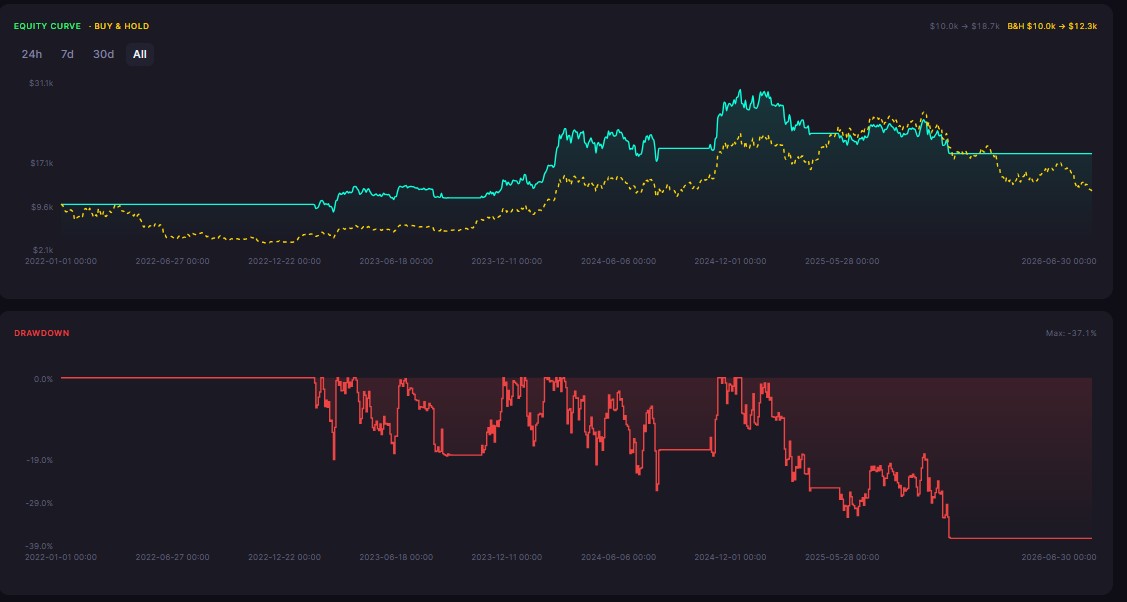
Backtest results (BTCUSDT daily, 2022-2026):
| Metric | Result |
|---|---|
| Total Return | +87.34% |
| Total Trades | 4 |
| Win Rate | 75.0% |
| Max Drawdown | 37.10% |
The Golden Cross generated the lowest number of trades (four in four and a half years) and the lowest max drawdown (37.10%) of all four strategies in this comparison. The 75% win rate reflects its ability to identify genuine trend changes when they occur.
Strategy 3: MACD Crossover
MACD (Moving Average Convergence Divergence) is a momentum indicator combining two EMAs and a signal line. Entry: MACD line crosses above signal line. Exit: crosses below.
Backtest results (BTCUSDT daily, 2022-2026):
| Metric | Result |
|---|---|
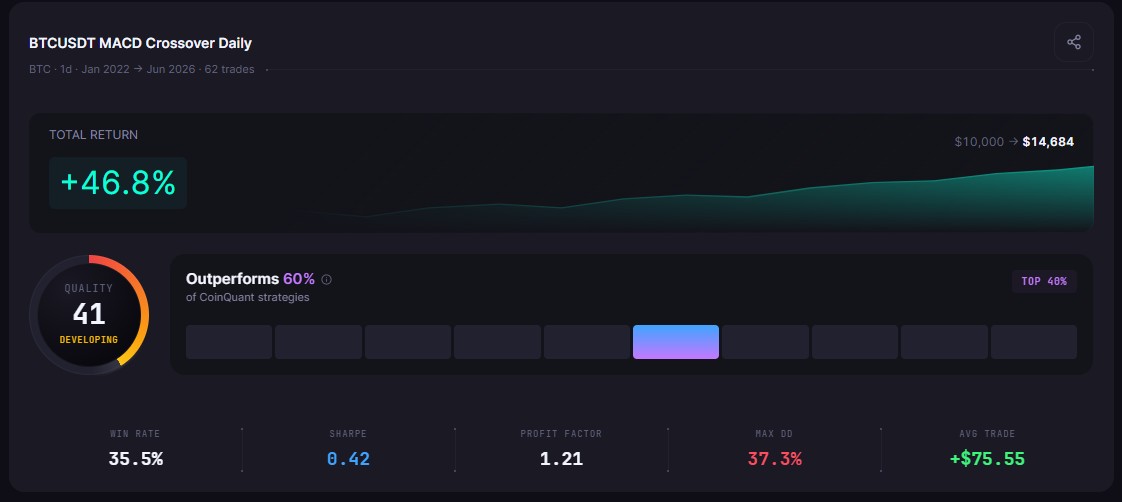
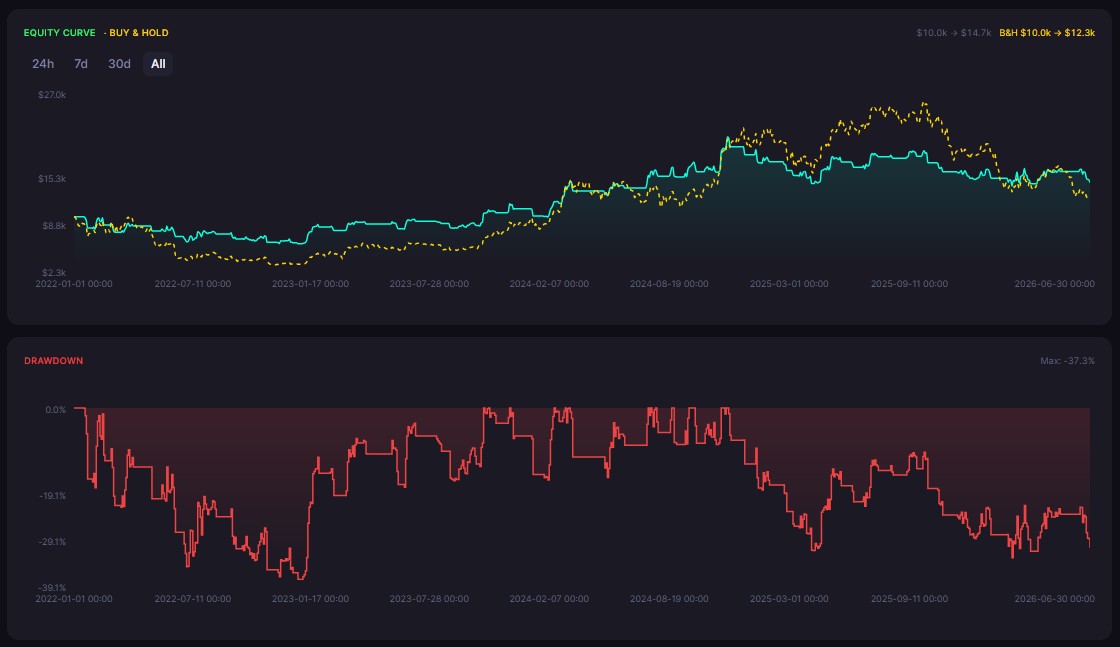
| Total Return | +46.84% |
| Total Trades | 62 |
| Win Rate | 35.5% |
| Max Drawdown | 37.28% |
The MACD strategy fired 62 trades across four and a half years, winning only 35.5% of them. Despite the low win rate, the positive total return (+46.84%) shows positive expectancy: the winning trades were large enough to compensate for the frequent small losses. The high trade count means more fees and more monitoring in live trading.
Strategy 4: Stochastic Oscillator
The Stochastic Oscillator measures where price sits relative to its recent high-low range. Entry: Stochastic crosses above 20. Exit: reaches 80.
Backtest results (BTCUSDT daily, 2018-2026):
| Metric | Result |
|---|---|
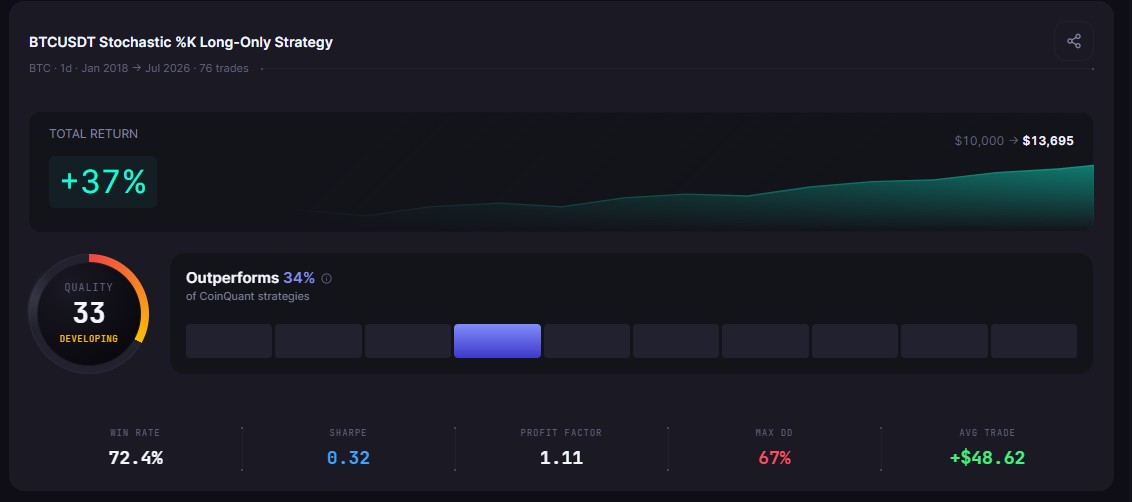
| Total Return | +36.95% |
| Total Trades | 76 |
| Win Rate | 72.4% |
| Max Drawdown | 66.97% |
The Stochastic produced a 72.4% win rate across 76 trades, the largest sample in this comparison. The max drawdown was 66.97%, the highest among the four strategies. The total return (+36.95%) is the lowest of the group, reflecting a regime mismatch between a mean-reversion strategy and a period that included genuine trending phases.
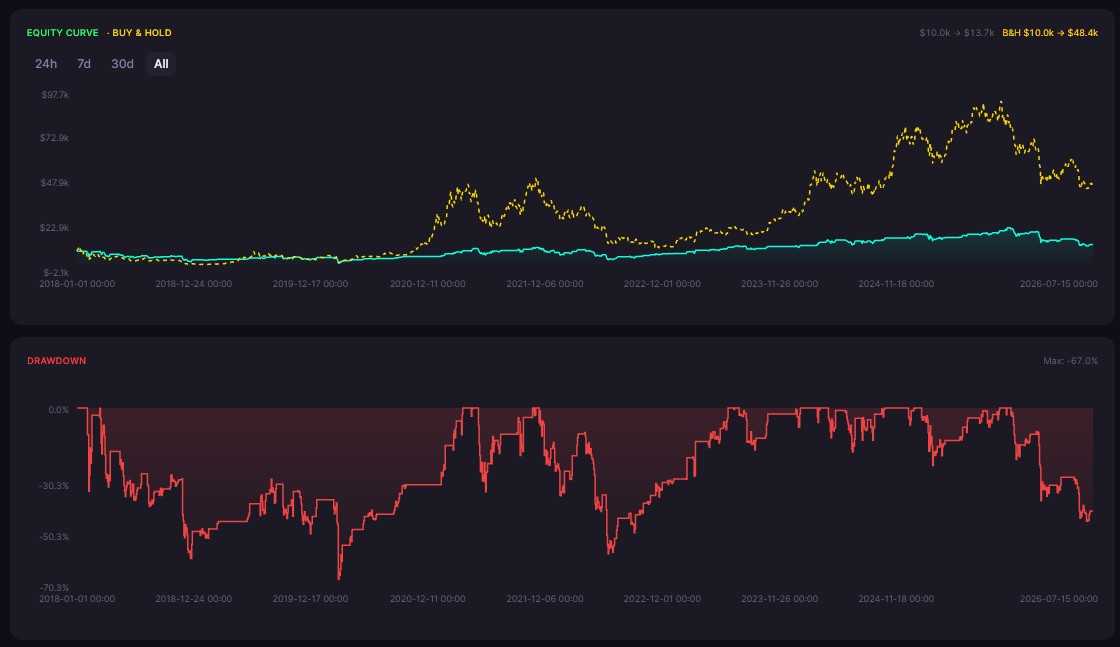
The Full Comparison
| Strategy | Period | Total Return | Trades | Win Rate | Max Drawdown |
|---|---|---|---|---|---|
| RSI Benchmark | 2018-2026 | +54.23% | 12 | 66.7% | 65.61% |
| Golden Cross | 2022-2026 | +87.34% | 4 | 75.0% | 37.10% |
| Stochastic | 2018-2026 | +36.95% | 76 | 72.4% | 66.97% |
| MACD Crossover | 2022-2026 | +46.84% | 62 | 35.5% | 37.28% |
| BTC Spot (Buy & Hold) | 2022-2026 | +22.80% | 1 | 100%* | 66.95% |
The results show that the most popular strategies are popular for a reason: all four produced positive returns. The differences in how they produce those returns are significant.
What the Comparison Shows
Highest total return overall: Golden Cross at +87.34% (2022-2026, 4 trades, 37.10% max drawdown). Among strategies tested over the full 2018-2026 period, RSI led at +54.23% with 65.61% max drawdown. Period context matters: RSI and Stochastic ran from 2018 while Golden Cross and MACD started in 2022.
Best overall result: Golden Cross at +87.34% with only 37.10% drawdown, the highest total return and lowest max drawdown in this comparison. Golden Cross also had the highest win rate at 75.0% across 4 trades. Stochastic had the second-highest win rate at 72.4% across 76 trades, which is the more statistically meaningful sample given the larger trade count.
Lowest signal frequency with strong results: Golden Cross at +87.34% with just four trades. Close to a "set and forget" approach that still outperformed DCA.
High frequency, lower efficiency: MACD at +46.84% with 62 trades. More monitoring, more fees, lower return than the other three.
The Regime Question
One important caveat: the test periods differ for RSI and Stochastic (2018-2026) vs. Golden Cross and MACD (2022-2026). A fully fair comparison would require running all four on the identical period, which can be done in minutes on CoinQuant.
The Stochastic has seen increased interest in 2025-2026 specifically because it performs well in ranging markets, and Bitcoin has been in a consolidation range for most of the recent period.
What Traders Are Actually Using
According to search and platform usage data, RSI remains the most searched indicator in crypto by a wide margin. Moving average crossovers are the second most common. MACD is third.
The strategy that is "most popular" in terms of search volume is RSI. The strategy that has had the best risk-adjusted backtest performance over the recent ranging period is the Stochastic.
Both are worth testing on your own assumptions before trading live.
Disclaimer:
Key Takeaway
