
BNB Trading Strategy vs Buy and Hold: Five Years of a Simple Relative Volatility Index Rule (2021-2026)

Is a BNB trading strategy vs buy and hold worth the extra work? Over five years, a simple Relative Volatility Index rule turned $10,000 into $6,616.04, a Total Return of -33.84% across 207 trades. Holding BNB on the same window returned 72.58%.
The rule did one thing better: its Max Drawdown was 59.44%, against 69.85% for holding. It got there by sitting out more than half of the window, and it paid $2,616.78 in fees to do it, against $27.27 for a single buy and sell.
The author ran both backtests on CoinQuant on the same window, capital and 0.1% fee. This article reports the results without adjustment. No tuned parameters, no cherry picked dates.
Why BNB, and Why We Test 2021-2026
BNB is the token of the Binance ecosystem and one of the coins earlier CoinQuant tests have covered, from a 52 week high breakout on BNB to a volume pressure rule on BNB through the 2022 rate hikes. This BNB backtest 2021-2026 asks a simpler question: does one plain rule beat just holding?
The window runs from 2021-08-01 to 2026-08-01. Five years is long enough to include a peak, the long fall of 2022 and the recovery after it, so the rule has to work through more than one kind of market.
The test ends on 1 August 2026. It says nothing about how BNB or this rule behaved after that date.
Holding is the bar to clear. A trading rule has to earn more than holding after fees, or give a much smoother ride for the same return, to be worth the extra orders.
What the Relative Volatility Index Measures
CoinQuant's Supported Elements page puts it in one line: "The Relative Volatility Index applies RSI-style math to volatility instead of price, showing whether volatility is rising or falling." Like the RSI, it runs from 0 to 100. The same page adds: "A high reading means volatility is expanding mostly on the upside; a low reading means it is expanding on the downside."
A BNB RVI strategy can use 50, the middle of that scale, as a simple line: in the market while the reading is above it, out while it is below. That is the whole rule here, with a period of 14 days. For the same indicator tested on Bitcoin, see what five years of RVI signals show on Bitcoin.
The Rule and the Settings
The rule buys BNB when the 14 day Relative Volatility Index crosses above 50 and sells when it crosses back below 50. There is no stop or target.
| Parameter | Setting |
|---|---|
| Strategy | BNB RVI 14 Midline 1D 2021-2026 |
| Instrument | BNBUSDT (spot, Binance) |
| Data source | Kaiko via CoinQuant |
| Timeframe | 1 day (1D) |
| Tested window | 2021-08-01 to 2026-08-01 |
| Entry | RVI (period 14) crosses above 50 |
| Exit | RVI (period 14) crosses below 50 |
| Direction | Long only, no leverage, one position at a time |
| Initial capital | $10,000 |
| Position size | 100% of equity per entry |
| Fees | 0.1% on entry and 0.1% on exit (fees included, no slippage modelled) |
| Baseline (same window) | BNB Buy and Hold 1D 2021-2026 |
The Strategy tab shows the stored rule as two lines, entry above exit, together with the setup.
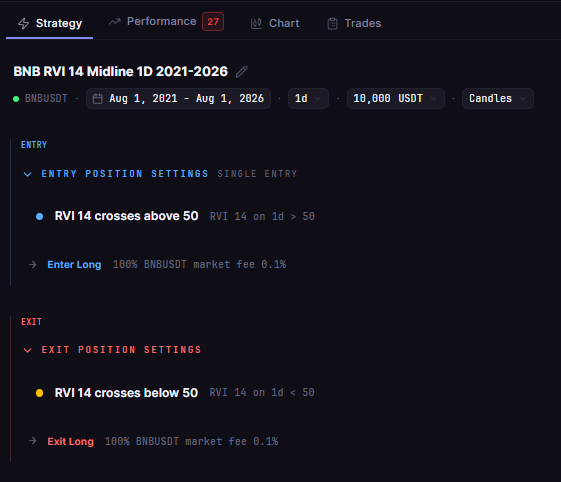
The stored rule: RVI(14) crosses above 50 to enter, below 50 to exit
BNB Trading Strategy vs Buy and Hold: Results Compared
The table sets the rule against holding BNB and, as a BTC Spot Comparison, against holding Bitcoin over the same five years.
| Metric | RVI 14 rule | BNB Buy and Hold | BTC Spot Comparison |
|---|---|---|---|
| Strategy | BNB RVI 14 Midline 1D 2021-2026 | BNB Buy and Hold 1D 2021-2026 | BTC Buy and Hold 1D 2021-2026 |
| Total Return | -33.84% | 72.58% | 57.33% |
| Final Balance | $6,616.04 | $17,257.91 | $15,733.43 |
| Total Trades | 207 | 1 | 1 |
| Win Rate | 22.71% (47W / 160L) | n/a (single hold) | n/a (single hold) |
| Profit Factor | 0.86 | n/a (single hold) | n/a (single hold) |
| Sharpe Ratio | -0.03 | 0.48 | 0.44 |
| Max Drawdown | 59.44% | 69.85% | 76.63% |
| CAGR | -7.93% | 11.52% | 9.48% |
| Total Fees | $2,616.78 | $27.27 | $25.74 |
All three runs share the window, capital, sizing and 0.1% fee on entry and exit. A Profit Factor of 0.86 means the rule's winning trades made 86 cents for every dollar its losing trades lost, after fees. CAGR is the steady yearly rate that reaches the same final balance: -7.93% a year for the rule, 11.52% for holding BNB.
The rule trailed holding BNB on Total Return, Sharpe Ratio and CAGR. Its only win was Max Drawdown. Holding BNB also beat holding Bitcoin over this window, 72.58% against 57.33%. Each hold is a single trade, so its card shows its QUALITY number next to "Statistically inconclusive" (1 trade · needs 50+ to rate).
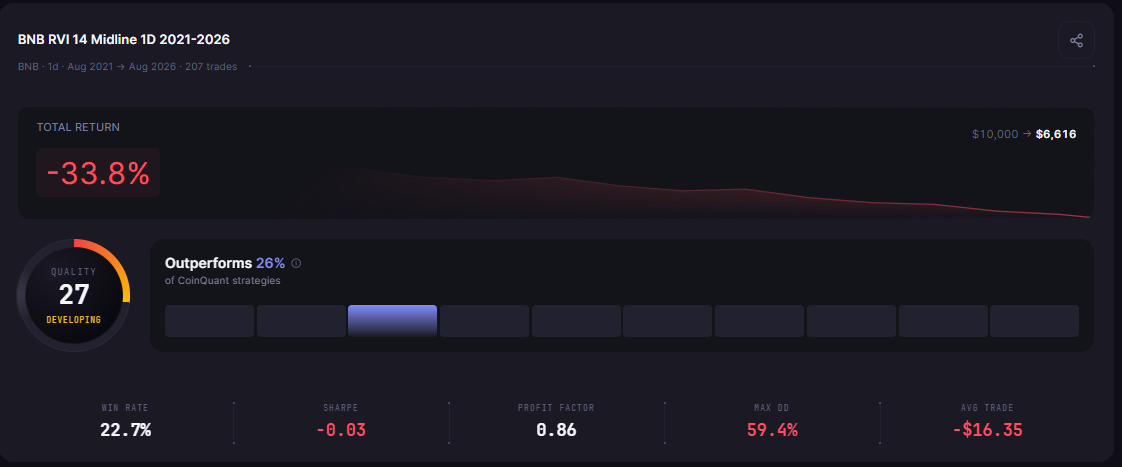
BNB RVI 14 Midline 1D 2021-2026: five years of daily BNB, 207 trades, -33.8% Total Return, $10,000 to $6,616, QUALITY 27
Time in Market, Fees and Drawdown
Sitting out is the usual case for a rule like this: miss the worst falls, accept missing some rises. The three numbers below show what that trade looked like on BNB.
| Measure | RVI 14 rule | BNB Buy and Hold |
|---|---|---|
| Strategy | BNB RVI 14 Midline 1D 2021-2026 | BNB Buy and Hold 1D 2021-2026 |
| Time in Market | 48.93% | 100% |
| Total Fees | $2,616.78 | $27.27 |
| Max Drawdown | 59.44% | 69.85% |
Time in Market is the share of the window the rule held a position. Being out for just over half of five years cut the worst fall only modestly, from 69.85% to 59.44%.
The cost was high. Across 207 round trips the rule paid $2,616.78 in fees, more than a quarter of the starting $10,000. Its average trade lost $16.35 after fees.
Only 47 trades won, so the gains from those trades could not cover 160 losses plus the fees. For the wider case, see active trading vs buy and hold in crypto.
What This Test Cannot Tell You
This is one coin, one rule and one window on daily bars. A different period, line or exit could behave very differently, and so could the same rule on another coin.
- Costs: fees included, no slippage modelled. Each trade pays 0.1% on entry and 0.1% on exit.
- Direction: long only, one position, no leverage. The rule never shorts the falls it sits out.
- Window: 2021-08-01 to 2026-08-01, past data only, with no claim about any later period.
- Rule design: the line at 50 and the period of 14 are fixed. A higher line, a longer period or a trend filter would be a different rule with its own result.
What the test does show is the size of the gap. On this window, a rule that traded 207 times finished 106.42 percentage points of Total Return behind a single buy and hold, and that gap is too wide to blame on one bad month.
The Practical Lesson
- Holding won on return: 72.58% for BNB Buy and Hold against -33.84% for the rule.
- The rule won only on drawdown: 59.44% against 69.85%, at the cost of $2,616.78 in fees.
- Many trades, few winners: 47 wins in 207 trades, with an average trade of -$16.35 after fees.
A rule that sits out half the time has to make up for its fees and missed rises. In CoinQuant, an AI trading platform, you can describe a rule like this in plain English with no coding required, then test it against holding the same coin. Before you trade a coin you would otherwise hold, test the rule against holding it on the same window with fees included, then compare the cards.
Build trading strategies on real data. No coding required.
Frequently Asked Questions
Is it better to trade BNB or hold it?
In this CoinQuant backtest, holding was better. BNB Buy and Hold returned 72.58% from 2021-08-01 to 2026-08-01, while the RVI 14 rule returned -33.84% across 207 trades. One rule cannot settle it for every strategy, but it shows how hard holding is to beat.
What does the Relative Volatility Index measure?
It measures the direction of volatility on a scale of 0 to 100. CoinQuant's Supported Elements page describes it as applying "RSI-style math to volatility instead of price, showing whether volatility is rising or falling."
Why compare a strategy with buy and hold?
Because holding is the simplest choice and costs almost nothing in fees. If a rule cannot beat it on the same window after fees, as this one could not, the extra trading added risk and cost without adding return.
Test your own BNB rule against holding, with fees, on the same five years.
Disclaimer:
Key Takeaway