
Relative Volatility Index Strategy Backtest on Bitcoin: What 5 Years of RVI Signals Show
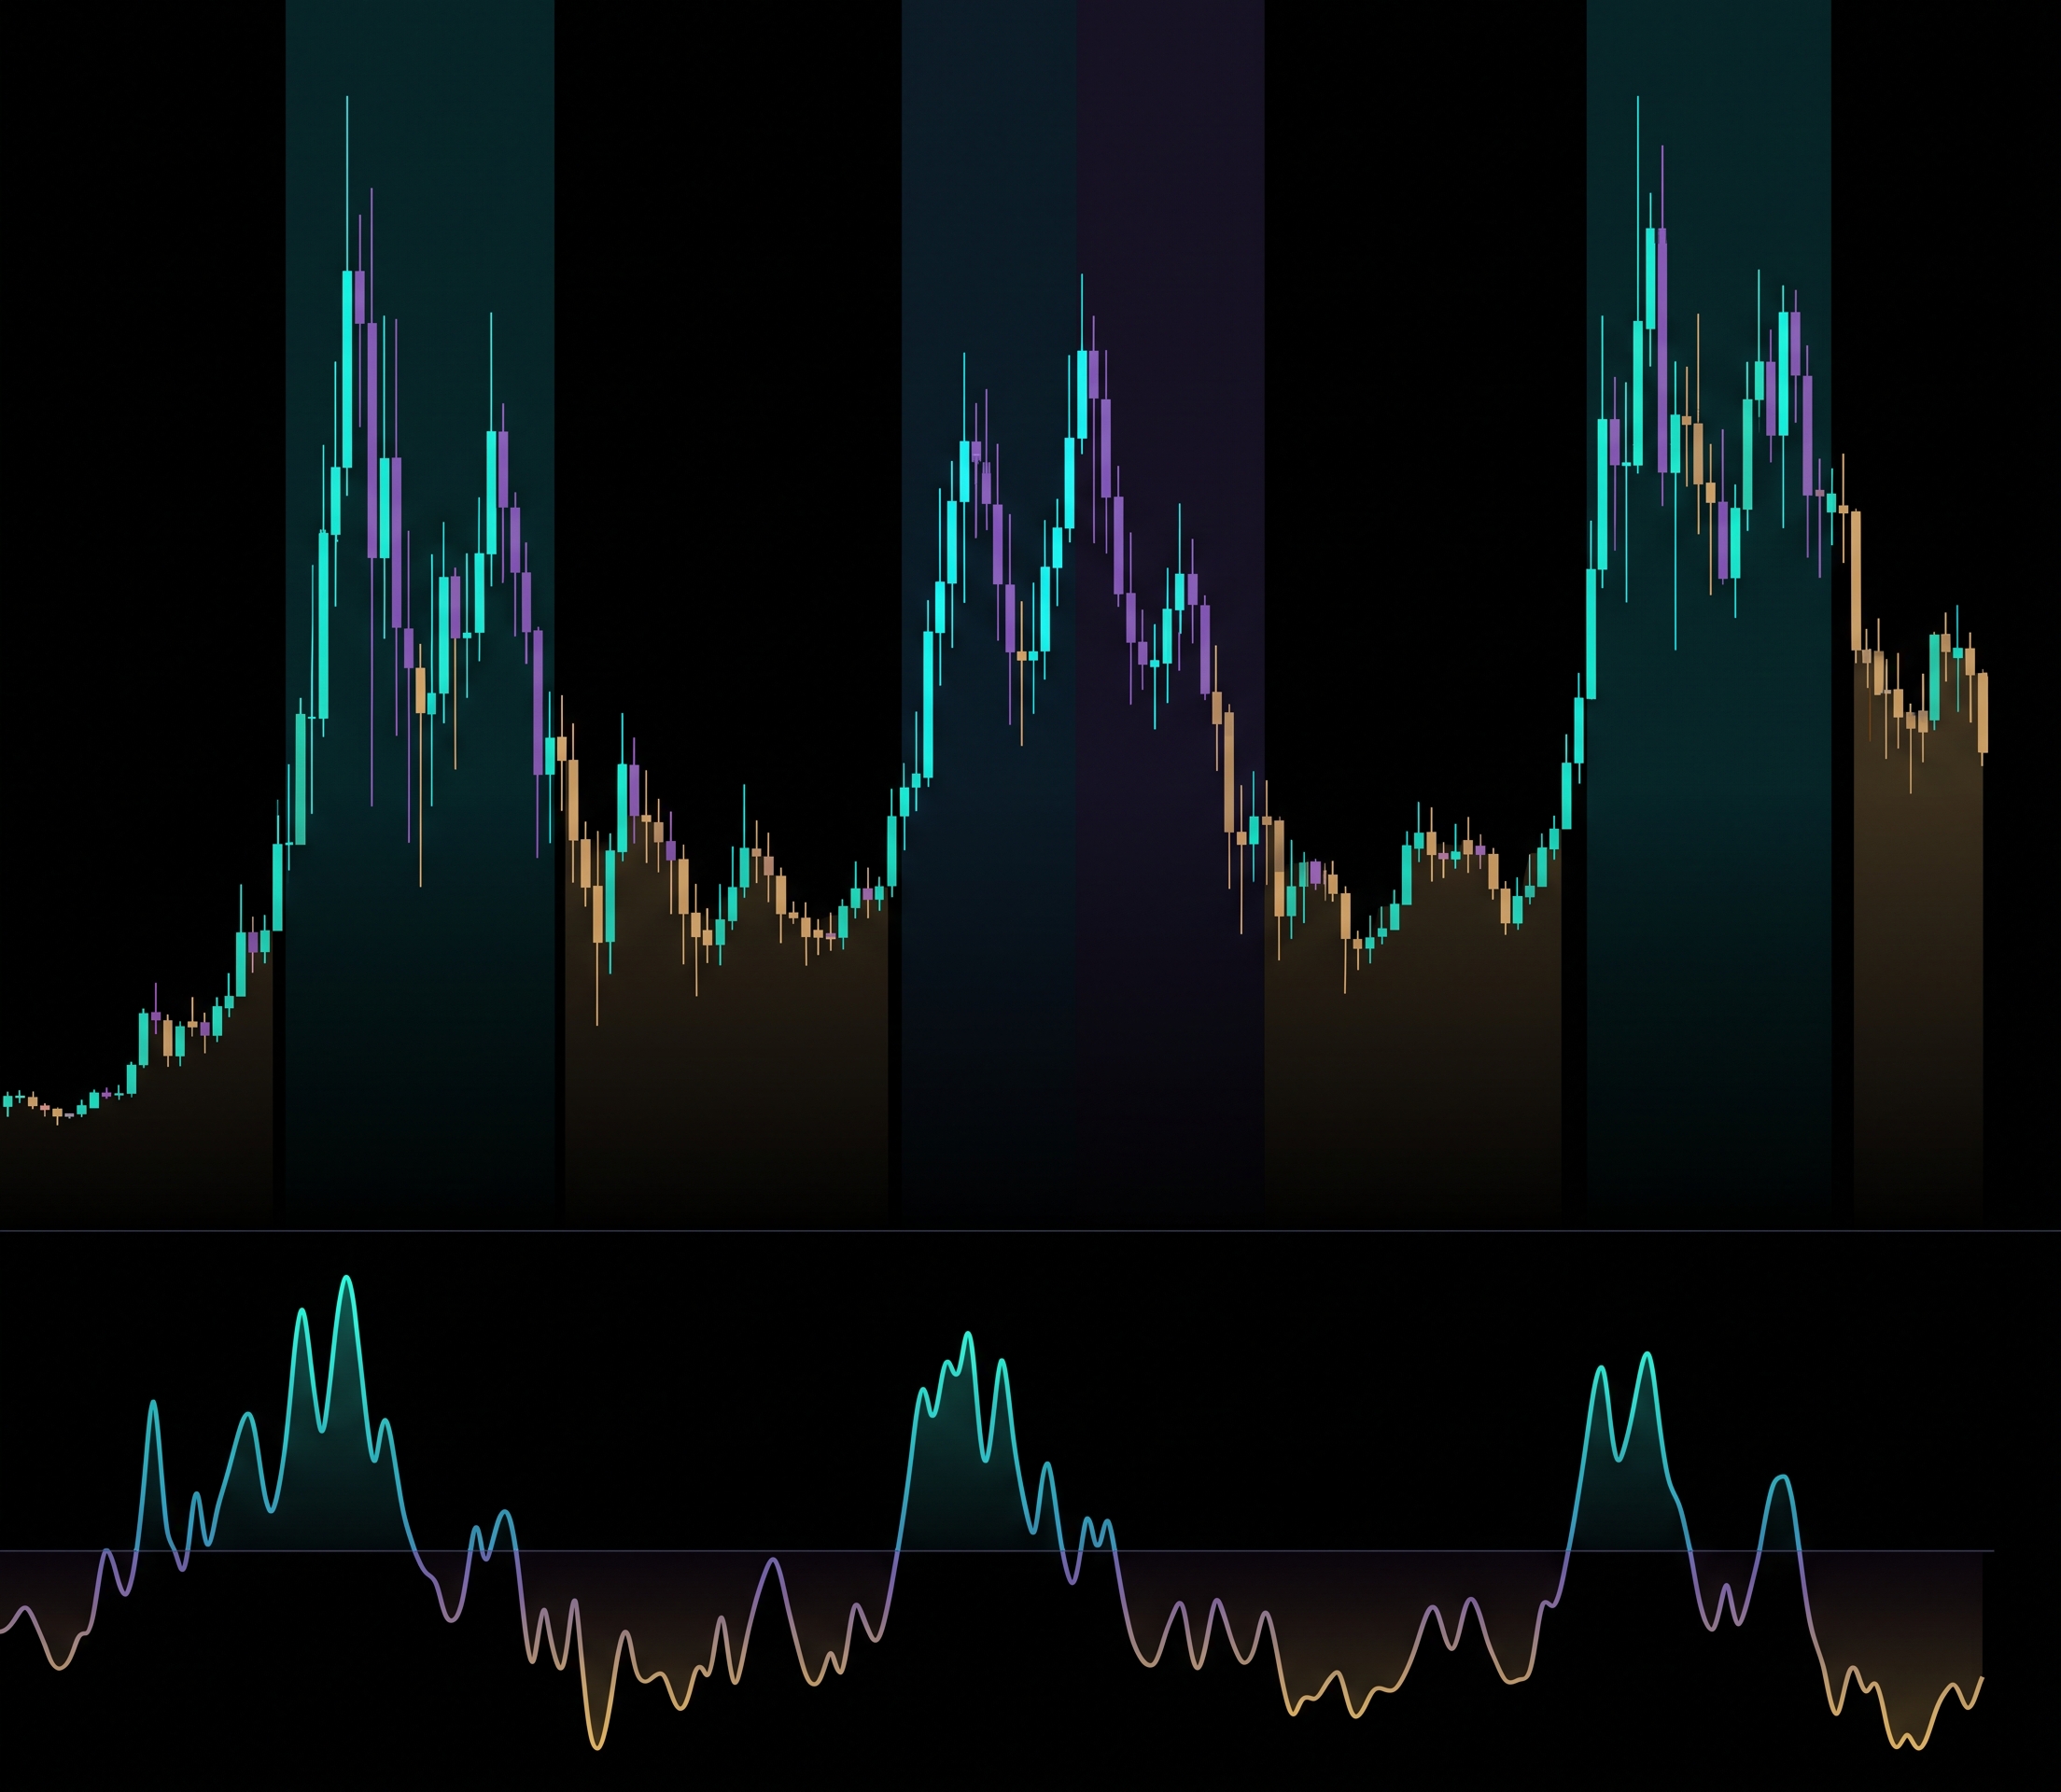
Every oscillator family has a quieter sibling. For the RSI, that sibling is the Relative Volatility Index: the same 0 to 100 scale, the same midline at 50, but built from volatility instead of price change. The pitch sounds clean. When the volatility inside up moves outweighs the volatility inside down moves, the RVI pushes above 50, and bulls supposedly have control.
This article tests that pitch on real Bitcoin data: a single mechanical strategy on BTCUSDT daily, from August 2021 to August 2026, with fees modeled, measured against simply holding Bitcoin.
One naming note before the results: the RVI here is the volatility-based Relative Volatility Index, the indicator this strategy uses. It is not the Relative Vigor Index, a different indicator that shares the same abbreviation with a completely different construction.
What the Relative Volatility Index Strategy Actually Does
The RVI takes the standard deviation of up days and the standard deviation of down days over a lookback window, then expresses the relationship as a 0 to 100 line, smoothed with a moving average. High readings mean upside volatility is dominant; low readings mean downside volatility is dominant. Traders use crossings of the 50 midline as a directional bias switch, the same way RSI readings above or below 50 get used.
This test uses the classic reading with a 10-period window and EMA smoothing:
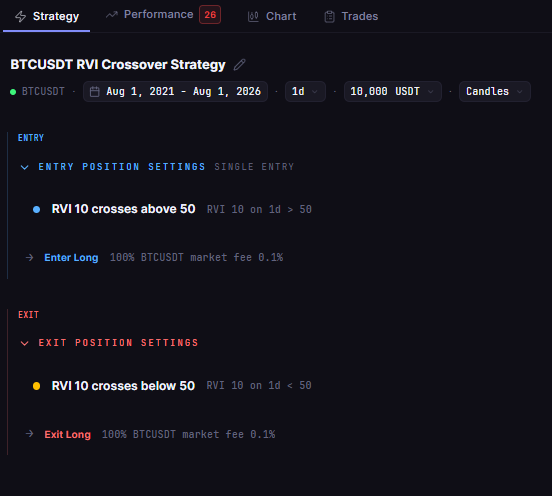
- Entry: the Relative Volatility Index (period 10) crosses above 50
- Exit: the index crosses below 50
Long only, one position at a time, no leverage, on BTCUSDT daily. No additional filters, no stop losses. If the midline really separates trend from noise, this simplest possible construction should show it.
Test Setup
| Parameter | Setting |
|---|---|
| Strategy | BTC Relative Volatility Index Cross 1D 2021-2026 |
| Instrument | BTCUSDT (spot, Binance) |
| Timeframe | Daily (1D) |
| Tested window | 2021-08-01 to 2026-08-01 |
| Entry | RVI(10, EMA) crosses above 50 |
| Exit | RVI(10) crosses below 50 |
| Direction | Long only, no leverage |
| Initial capital | $10,000 |
| Position size | 100% of equity per entry |
| Fees | 0.1% taker, modeled |
| Data source | Kaiko via CoinQuant |
| Baseline | BTC Buy and Hold 1D 2021-2026 (same window) |
The Backtest Results
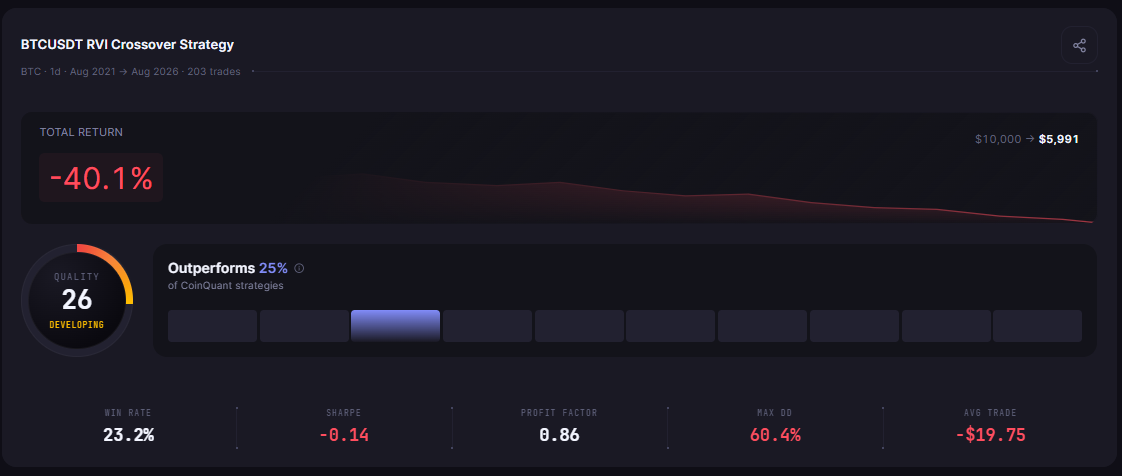
The RVI cross turned $10,000 into $5,991.02, a -40.09% loss from 203 trades, while Bitcoin finished the same window up 57.33%.
| Metric | Strategy | Buy and Hold |
|---|---|---|
| Total Return | -40.09% | +57.33% |
| Final Balance | $5,991.02 | $15,733.43 |
| Total Trades | 203 | 1 |
| Win Rate | 23.2% (47W / 156L) | n/a (single hold) |
| Profit Factor | 0.86 | n/a |
| Sharpe Ratio | -0.14 | 0.44 |
| Sortino Ratio | -0.20 | 0.63 |
| Max Drawdown | 60.37% | 76.63% |
| Average Win | $517.84 | n/a |
| Average Loss | $181.71 | n/a |
| Best Trade | +$3,494.69 | n/a |
| Worst Trade | -$789.08 | n/a |
| Time in Market | 47.13% | 100% |
| Total Fees | $3,085.19 | $25.74 |
| CAGR | -9.73% | +9.48% |
What the Data Shows
The first finding is blunt: the RVI crossover buried itself. -40.09% against a market that rose 57.33%, with 203 trades paying $3,085.19 in fees along the way. A signal that loses this much while sitting out half the market days is failing at its one job, which is telling trend from noise.
The second finding is where the money leaked. The average loss was small ($181.71) and the average win nearly three times bigger ($517.84), yet the win rate sat at 23.2%: 156 losses against 47 wins. A profit factor of 0.86 means every dollar lost returned only 86 cents of gross profit, before the fee line makes it worse. The pattern is a textbook whipsaw: the index crosses 50, price wobbles, the index crosses back, and another pair of fees goes out the door.
The third finding is the shape of the equity path through the years. The strategy bled through the 2021 chop (-$2,322.73 across 21 trades) and the 2022 bear (-$3,378.36 across 36), recovered with the market in 2023 (+$3,543.17) and 2024 (+$2,109.04), then gave most of it back in the 2025 chop (-$3,403.06 across 45 trades) and the 2026 decline (-$556.94). The single best trade, +$3,494.69, rode the February to March 2024 surge from $42,708 to $61,937. The single worst, -$789.08, died in one bar in March 2025.
The fourth finding is the one genuine point in the strategy's favor: its maximum drawdown of 60.37% was shallower than holding's 76.63%. The midline did pull the strategy out of the worst drawdown stretches. It just charged a fortune in fees and missed upside to do it.
Why the RVI Midline Fails as a Standalone Trigger
The appeal of the 50-cross is visual: when you line an RVI chart up against price, the crossings look like they catch turns. They do catch turns. They also catch every hesitation, pullback, and consolidation in between, and on a daily Bitcoin chart those are most of the bars. Volatility dominance flips faster than trend direction does, so a pure volatility-based switch spends much of its life whipping back and forth across its own midline.
There is also a measurement subtlety worth knowing. The RVI compares the size of up moves with the size of down moves, not their direction or persistence. A violent crash can send it surging just as easily as a violent rally, and a slow, grinding trend can leave it near 50 for weeks while price climbs steadily. That mismatch is why the indicator tends to serve as a confirmation layer behind another signal, and why it struggles when the midline is asked to be the entire strategy.
What the five years show is not that the tool is broken. It is that the simplest available reading of any oscillator, cross the middle and change the bias, is not an edge on its own. The tests that came before this one taught the same lesson about speed and frequency; this one adds volatility to the list.
The Practical Lesson
- The raw RVI(10) 50-cross returned -40.09% on daily BTC over five years, versus +57.33% for simply holding
- 203 trades produced $3,085.19 in fees, a 0.86 profit factor, and a 23.2% win rate: far more crossing than trending
- The strategy's 60.37% drawdown was gentler than holding's 76.63%, but it paid for that in lost upside
- The gains clustered in two strong trend years (2023 and 2024); the damage came from rangebound markets, where a midline cross has no edge
The Relative Volatility Index deserves its place in a trader's toolkit as a volatility context tool. Five years of Bitcoin data say it does not deserve the middle line as a full trading system. Test it as a filter behind entries you trust, and let it inform position confidence instead of choosing positions alone.
Run this RVI backtest yourself and test your own volatility settings on CoinQuant. Backtest momentum strategies free on CoinQuant
Disclaimer:
Key Takeaway
