
How a Volume Pressure Rule Traded BNB Through the 2022 Rate Hikes (2021-2026)
With the Fed raising rates again in September 2026, traders are asking a fair question: is there a crypto strategy rising interest rates cannot break? We tested one simple rule on BNB across five years that include the whole 2022 hiking year. It returned 80.36% after fees, ahead of holding BNB, but the 98 trades it opened in 2022 netted -$4,687.80.
The cost of getting there was high. The rule's Max Drawdown reached 74.77%, deeper than holding BNB, and it paid $9,976.99 in fees across 482 trades.
This article shows the rule, the result over five years, the 2022 trades and a comparison with holding BNB and BTC on the same window. The author ran every backtest on CoinQuant and reports the results without adjustment.
One Crypto Strategy, Rising Interest Rates: 2022 and 2026
The Federal Reserve began its 2022 hikes on 16 March 2022. Its statement that day says the Committee "decided to raise the target range for the federal funds rate" and "anticipates that ongoing increases in the target range will be appropriate." So this test treats calendar 2022, the year the hikes began, as the hiking year inside its 2021 to 2026 window.
Rates are back in the news. A crypto.news report says "the 10 year yield recently climbed above 5.3%", and CryptoTicker notes that the Fed's September 2026 rise was "the first increase since July 2023". Crypto.news also spells out why yields matter: "Higher government bond yields give investors a relatively attractive return on lower risk assets and can make speculative assets less appealing".
This article does not forecast rates or prices. It asks a narrower question: what did one rule on BNB do in 2022, when the previous run of hikes began, compared with the rest of its five years?
The Rule: Volume Pressure Index (Period 20) Crosses Zero
CoinQuant's Supported Elements page defines the indicator in one line: "The Volume Pressure Index measures whether buyers or sellers are in control by reading where price closes within each bar, weighted by volume." This rule reads a cross above zero as buyers taking control and a cross below zero as sellers taking over.
The rule is stored in the author's strategy library as BNB Volume Pressure Index 20 Zero Cross 1D 2021-2026. In plain words: buy when the Volume Pressure Index (period 20, smoothed with an exponential moving average) crosses above zero, and sell when it crosses below zero. There are no stops and no filters.
| Parameter | Setting |
|---|---|
| Strategy | BNB Volume Pressure Index 20 Zero Cross 1D 2021-2026 |
| Instrument | BNBUSDT (spot, Binance) |
| Data source | Kaiko via CoinQuant |
| Timeframe | Daily (1D) |
| Tested window | 2021-08-01 to 2026-08-01 |
| First trade to last exit | 2021-08-04 to 2026-07-31 |
| Volume Pressure Index settings | Period 20, exponential moving average smoothing, zero line |
| Entry | Volume Pressure Index crosses above 0, market order |
| Exit | Volume Pressure Index crosses below 0, market order |
| Direction | Long only, no leverage, one position at a time |
| Initial capital | $10,000 |
| Position size | 100% of equity per entry |
| Fees | 0.1% on entry and 0.1% on exit (no slippage set) |
| Baselines (same window) | BNB Buy and Hold 1D 2021-2026; BTC Buy and Hold 1D 2021-2026 |
Five-Year Results on BNB
Over the full window the rule turned $10,000 into $18,036.06, a Total Return of 80.36%. It won 41.49% of its 482 trades with a Profit Factor of 1.13, and its Max Drawdown was 74.77%.
| Metric | Volume Pressure Index rule | BNB Buy and Hold | BTC Spot Comparison |
|---|---|---|---|
| Strategy | BNB Volume Pressure Index 20 Zero Cross 1D 2021-2026 | BNB Buy and Hold 1D 2021-2026 | BTC Buy and Hold 1D 2021-2026 |
| Total Return | 80.36% | 72.58% | 57.33% |
| Final Balance | $18,036.06 | $17,257.91 | $15,733.43 |
| Total Trades | 482 | 1 | 1 |
| Win Rate | 41.49% (200W / 282L) | n/a (single hold) | n/a (single hold) |
| Profit Factor | 1.13 | n/a (single hold) | n/a (single hold) |
| Sharpe Ratio | 0.49 | 0.48 | 0.44 |
| Max Drawdown | 74.77% | 69.85% | 76.63% |
| CAGR | 12.51% | 11.52% | 9.48% |
| Total Fees | $9,976.99 | $27.27 | $25.74 |
All three runs share the same window, capital, sizing and 0.1% fee on entry and exit, so the rows compare like with like. CAGR is the steady yearly growth rate that would reach the same final balance over the five years.
The two Buy and Hold runs are single holds of one trade each, so their results cards mark them "Statistically inconclusive": they need 50+ trades to rate. With 482 trades, the rule's own card gives a Quality rating.
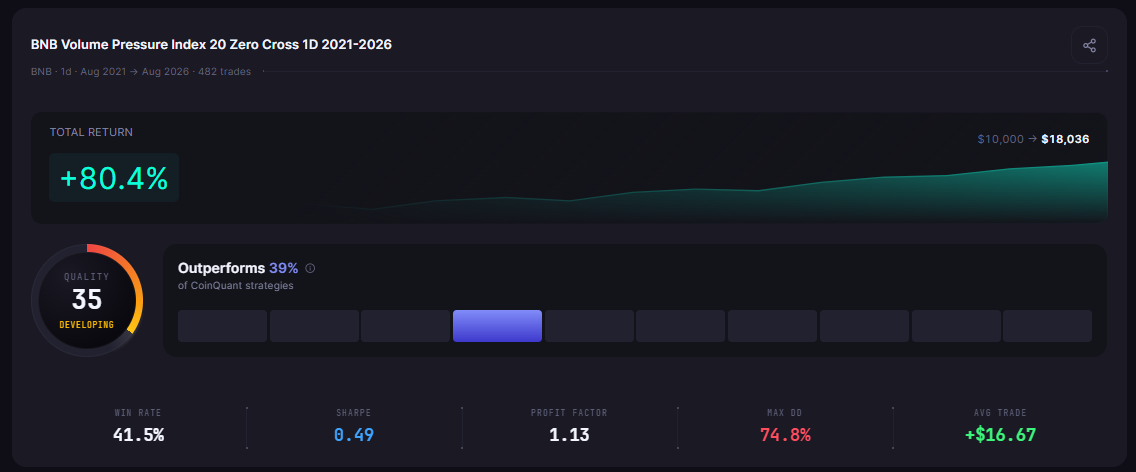
BNB Volume Pressure Index 20 Zero Cross 1D 2021-2026 results card: 482 trades, +80.4% Total Return, $10,000 to $18,036, Quality score 35
The 2022 Hiking Year in the Trade Log
To isolate the hiking year, we grouped the rule's trades by entry date (UTC). The figures below are arithmetic on the trade log, after fees:
- Trades entered in 2022: 98
- Winners: 31, so fewer than a third won, against 41.49% over the full window
- Net result of those 98 trades: -$4,687.80 after fees
By entry year, 2022 was the rule's weakest year in the log. The trades entered in 2024 and 2025 made more than the net profit of the whole window, which shows how unevenly the result was earned.
The year opened badly: the first three trades of 2022, all closed by 10 January, were losers. The Trades tab shows them as six rows, because the log numbers orders, not trades. Each trade is an Entry row and an Exit row, the Exit row carries the trade's Net PnL after both fees, and times are UTC.
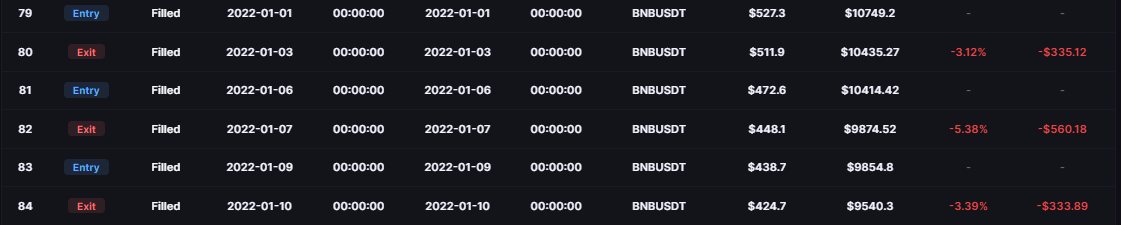
The BNB rule's first orders of 2022: order rows 79 to 84, Entry and Exit rows from 1 to 10 January 2022, all Filled (times UTC)
One shot can show only the start of the year: the 98 trades of 2022 take about 196 rows.
Buy and Hold Comparison: BNB Held on the Same Window and Fee
BNB Buy and Hold 1D 2021-2026 is its own strategy in the library: it buys on the first day of the window, holds to the end and pays the same 0.1% fee on entry and exit. The results card does not show it, so the comparison comes from its own backtest.
- Total Return: the rule finished ahead, 80.36% against 72.58%.
- Max Drawdown: the rule fell further, 74.77% against 69.85%.
- Sharpe Ratio: almost level, 0.49 against 0.48.
- Time in market: the rule held BNB 52.65% of the time; Buy and Hold held it the whole time.
The fees tell the rest of the story. The rule paid $9,976.99 against $27.27, more than its whole net profit of $8,036.06. Its median trade lost $45.61, its median holding time was one daily bar, and at one point it lost 10 trades in a row.
Against the BTC Spot Comparison, both BNB runs did better on Total Return: BTC Buy and Hold 1D 2021-2026 returned 57.33% with a 76.63% Max Drawdown. For a different volume indicator tested on Bitcoin, see the Klinger Volume Oscillator backtest on Bitcoin.
What This Test Cannot Tell You
This is one coin, one rule and one window on daily bars, with a 0.1% fee and no slippage set. Change any of those and the numbers change.
Rates were one of many forces in 2022. The test shows what the rule did while rates rose; it does not show that rates caused the losses, and it does not predict what the rule would do in another hiking cycle. For a wider view of how strategies hold up in falling markets, see backtesting a crypto strategy in a bear market.
The 98 trades of 2022 come from a single rule on a single coin in a single year. Treat the -$4,687.80 as a description of the past, not a forecast.
The Practical Lesson
- 2022 was its weakest year: the trades entered in 2022 netted -$4,687.80 after fees.
- It still beat holding BNB: 80.36% against 72.58% over five years, with a deeper 74.77% Max Drawdown.
- Fees are the hidden cost: $9,976.99 in fees on 482 trades, more than the net profit.
Before you trust any crypto strategy when rates rise, split its trade log by year and check the hiking year on its own. In CoinQuant, an AI trading platform, you can describe a rule like this in plain English, run it on the same coin and window as Buy and Hold, then check the Trades tab rows by entry date.
Build trading strategies on real data. No coding required.
Frequently Asked Questions
How do rising interest rates affect crypto?
Higher yields raise the return on safer assets. As crypto.news puts it, they "can make speculative assets less appealing". How much that matters for a given strategy is something only its own trade log can show.
What happened to crypto when the Fed raised rates in 2022?
The Fed began hiking on 16 March 2022. In this test, the BNB Volume Pressure Index rule's 98 trades entered in 2022 netted -$4,687.80 after fees, its weakest year by entry date.
What is the Volume Pressure Index?
CoinQuant's Supported Elements page describes it as a measure of "whether buyers or sellers are in control by reading where price closes within each bar, weighted by volume." This rule bought when it crossed above zero and sold when it crossed below.
Run the same Volume Pressure Index rule on your own coin and check its 2022 trades on their own.
Run this BNB volume pressure backtest on CoinQuant (https://app.coinquant.ai/?ref=NSfBKvpv)
Disclaimer:
Key Takeaway