
A Simple Bitcoin Trading Strategy, Tested: One Rule, Five Years, Fees Included (2021-2026)

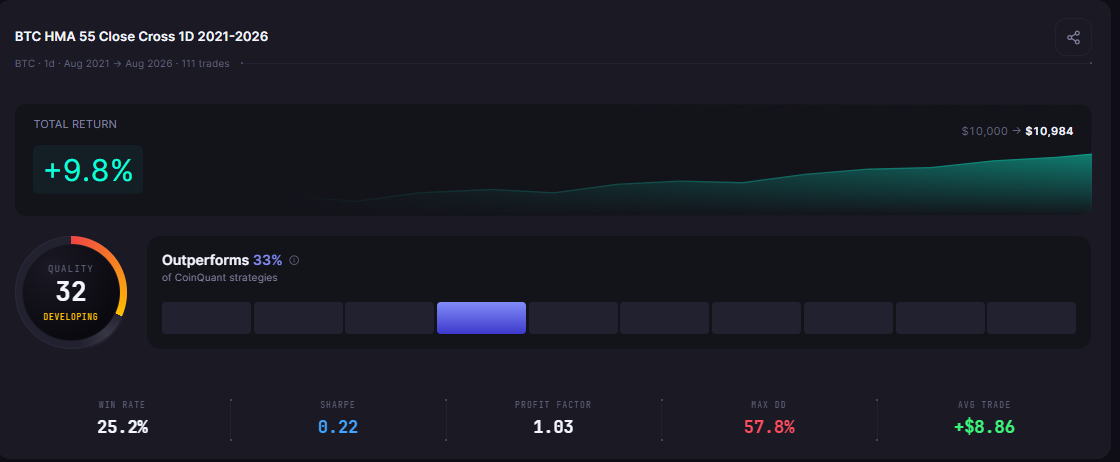
A simple Bitcoin trading strategy is one rule you can say in a sentence and follow without judgment. The author tested one on CoinQuant: buy Bitcoin when the daily close crosses above the 55 day Hull Moving Average (HMA), and sell when it crosses back below. From August 2021 to August 2026 it turned $10,000 into $10,983.52, a Total Return of 9.84% over 111 trades, with fees included.
Holding Bitcoin over the same five years returned 57.33%. The rule also paid $2,323.16 in fees, more than twice its net gain of $983.52. The rule was simple and easy to test, and the test shows it trailed holding by a wide margin.
Both runs charge a 0.1% fee on every entry and exit, with no slippage modelled. This article reports the results without adjustment. No tuned parameters, no cherry picked dates.
What Counts as a Simple Bitcoin Trading Strategy
A trading strategy is a fixed set of rules that says when to buy, when to sell and how much to trade. A simple one has few moving parts and leaves nothing to judgment.
- One input: the daily close and one moving average.
- One entry and one exit: a cross above to buy, a cross below to sell.
- No stop, target or filter: nothing to adjust after the fact.
- One position: fully in or fully out, never short.
That makes it a Bitcoin trend following strategy in its plainest form: it holds Bitcoin only while the close sits above its average. Simple does not mean good. It means you can check whether the rule works, because nothing is hidden in it.
For a test that adds two more conditions to the same kind of entry, see Simple vs Complex Trading Strategy: One Entry Rule vs Three in a Matched Bitcoin Backtest. For simple rules on other coins, see a simple crypto trading strategy that actually works, backtested.
The Rule and the Settings
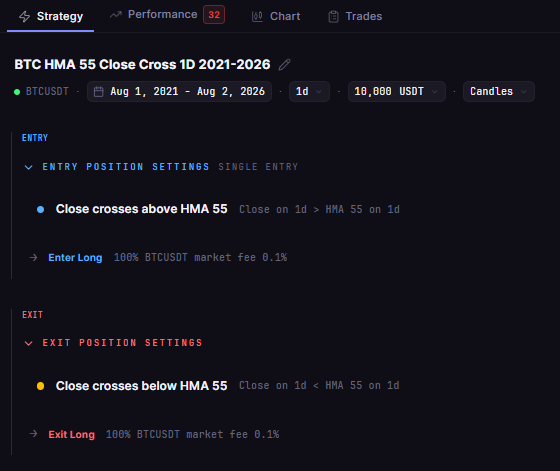
This is the rule as it was typed into the CoinQuant builder, in plain English with no code (excerpt):
... Enter long when the daily close crosses above the Hull Moving Average (55). Exit long when the daily close crosses below the Hull Moving Average (55). ...
CoinQuant's Supported Elements page describes the HMA as "a fast-reacting moving average that smooths out price noise while staying close to current price, so you can spot trend changes earlier than with a normal moving average." For the same indicator on Ether, see what five years of HMA signals show on Ethereum.
| Parameter | Setting |
|---|---|
| Strategy | BTC HMA 55 Close Cross 1D 2021-2026 |
| Instrument | BTCUSDT (spot, Binance) |
| Data source | Kaiko via CoinQuant |
| Timeframe | Daily (1D) |
| Tested window | 2021-08-01 to 2026-08-01 |
| First trade to last exit | 2021-08-20 to 2026-07-27 |
| Entry | Daily close crosses above HMA (period 55) |
| Exit | Daily close crosses below HMA (period 55) |
| Direction | Long only, no leverage, one position at a time |
| Initial capital | $10,000 |
| Position size | 100% of equity per entry |
| Fees | 0.1% taker fee on entry and on exit (fees included, no slippage modelled) |
| Baseline (same window) | BTC Buy and Hold 1D 2021-2026 |
The Strategy tab shows the stored rule in two lines, the entry listed above the exit, so you can check that the backtest ran exactly what the prompt asked for.
Result and Buy and Hold Comparison
Holding Bitcoin is the BTC Spot Comparison here: the same coin, window, capital and fee.
| Metric | HMA 55 rule | BTC Spot Comparison (BTC Buy and Hold) |
|---|---|---|
| Strategy | BTC HMA 55 Close Cross 1D 2021-2026 | BTC Buy and Hold 1D 2021-2026 |
| Total Return | 9.84% | 57.33% |
| Final Balance | $10,983.52 | $15,733.43 |
| Total Trades | 111 | 1 |
| Win Rate | 25.23% (28W / 83L) | n/a (single hold) |
| Profit Factor | 1.03 | n/a (single hold) |
| Sharpe Ratio | 0.22 | 0.44 |
| Sortino Ratio | 0.34 | 0.63 |
| Max Drawdown | 57.77% | 76.63% |
| CAGR | 1.89% | 9.48% |
| Total Fees | $2,323.16 | $25.74 |
Holding won on Total Return, Sharpe Ratio and CAGR. CAGR is the steady yearly rate that reaches the same final balance: 1.89% a year for the rule, 9.48% for holding. The rule's one clear edge was a shallower worst fall, a Max Drawdown of 57.77% against 76.63%. It was in the market 49.26% of the time, so it sat in cash for about half of the five years, which helps explain both the smaller drawdown and the part of the rise it missed.
Fees were a large drag. The rule placed 222 orders at 0.1% each, $2,323.16 in total, against $25.74 for the single hold. A Profit Factor of 1.03 means the winning trades made $1.03 for every $1 the losing trades lost, after those fees. Holding is a single trade, which makes it a baseline, not a sample.
With 111 trades, the card can rate the rule. On the Performance tab it shows a QUALITY of 32 next to its "Outperforms" box, which compares the run with other CoinQuant strategies.
What the Rule Did in the 2022 Fall and the 2024 Rise
The rule's equity peaked at $12,804.13 on 20 October 2021 and fell to $5,407.19 by 28 November 2022, the 57.77% Max Drawdown in the table. Holding's worst drawdown ran from 8 November 2021 to 21 November 2022 and reached 76.63%.
| Year (by exit date, UTC) | Trades closed | Net result after fees |
|---|---|---|
| 2022 | 26 | -$4,675.38 |
| 2024 | 22 | $5,973.18 |
In 2022 the rule kept buying rallies that failed, and each failed rally cost two fees: 26 trades closed that year for a net -$4,675.38. In 2024 it went the other way, with 22 trades closed for a net $5,973.18 after fees.
Across all five years, the rule won about one trade in four, a Win Rate of 25.23%. It still finished up because its average win, $1,057.49, was about three times its average loss of $344.89. The best trade made $3,251.33 and the worst lost $1,267.07. For a faster setting, a 10 period HMA on daily Bitcoin with its own test window, see BTC HMA Strategy Daily Backtest Results.
How to Judge a Simple Rule
- Compare it with holding: same coin, same window. Here, 9.84% against 57.33%.
- Count the trades: 111 is enough for the card to rate; under 50 is not. See How Many Trades Does a Backtest Need Before You Can Trust It?
- Set fees against the net gain: $2,323.16 in fees against a $983.52 net gain.
- Read the Max Drawdown: ask whether you could sit through a 57.77% fall from the peak.
- Try a second coin or window: for five different approaches on Bitcoin, see Bitcoin Trading Strategy: 5 Approaches Backtested Over 7 Years.
What This Test Cannot Tell You
This is one rule, one setting and one window on daily bars. Change any of them and the result changes.
- Costs: fees included, no slippage modelled. Each trade pays 0.1% on entry and 0.1% on exit.
- Direction: long only, one position, no leverage. The rule never shorts the falls it sits out.
- Window: 2021-08-01 to 2026-08-01. The test says nothing about Bitcoin after that date.
- Setting: the 55 day length is fixed. Other lengths are other rules, with their own results.
- Sample: 111 trades is enough to rate, but it is still one five year path.
Past results do not predict future results.
The Practical Lesson
- Simple and testable: one entry and one exit, the daily close against HMA(55).
- It trailed holding: 9.84% against 57.33% for holding Bitcoin, 2021-08-01 to 2026-08-01.
- Fees mattered: $2,323.16 in fees, more than twice the $983.52 net gain.
A simple rule is easy to follow and easy to test. This one paid more in fees than it made, which only shows up when you test it with fees included. In CoinQuant, an AI trading platform, you type a rule like this in plain English with no coding required and see the result, fees included, before you trade it.
Build trading strategies on real data. No coding required.
Frequently Asked Questions
What is a simple Bitcoin trading strategy?
One rule you can say in a sentence. Here: buy when the daily close crosses above the 55 day Hull Moving Average, and sell when it crosses back below. It holds one position, never shorts and has nothing to tune.
Did it beat holding Bitcoin?
No. From 2021-08-01 to 2026-08-01 the rule returned 9.84% and holding returned 57.33%. The rule's Max Drawdown was smaller, 57.77% against 76.63%.
How much did fees cost?
$2,323.16 across 111 trades, at 0.1% on each entry and exit. That is more than twice the rule's net gain of $983.52. Holding paid $25.74.
Try the same rule with a different length or on another coin, fees included.
Disclaimer:
Key Takeaway