
Hull Moving Average Strategy Backtest on Ethereum: What 5 Years of HMA Signals Show
The Hull Moving Average has one job, and it does that job better than almost anything else: it stays close to price. Created by Alan Hull to solve the classic moving average trade-off between smoothness and responsiveness, the HMA uses weighted averages and a final smoothing pass to turn faster than an EMA while still filtering noise.
That speed makes it a favorite trend line on crypto charts, where moves happen quickly and lag is expensive. The question this article answers is whether the speed converts into a tradeable edge: a single mechanical HMA strategy, tested on daily Ethereum from August 2021 to August 2026, fees included, against buy and hold on the same market.
The result is a clean warning about what fast signals cost when they are used alone.
What the Hull MA Strategy Actually Does
The Hull Moving Average combines two weighted moving averages and a smoothing step so that the line turns sooner than a conventional average while staying smooth. Traders read it the same way they read any trend line: price above a rising HMA is a bullish stance, price below a falling one is bearish.
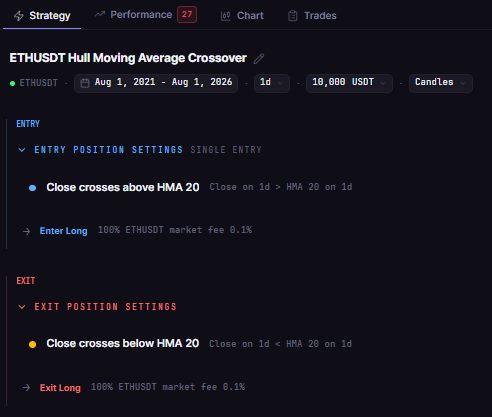
This test uses the standard single-line reading with the platform's default period of 20:
Entry: close crosses above HMA(20)
Exit: close crosses below HMA(20)
That is "follow the line" in its purest form: hold Ethereum while price holds above the HMA, step aside when it drops below. Long only, one position at a time, no leverage, no additional filters.
Test Setup
| Parameter | Setting |
|---|---|
| Strategy | ETH Hull MA Cross 1D 2021-2026 |
| Instrument | ETHUSDT (spot, Binance) |
| Timeframe | Daily (1D) |
| Tested window | 2021-08-01 to 2026-08-01 |
| Entry | Close crosses above HMA(20) |
| Exit | Close crosses below HMA(20) |
| Direction | Long only, no leverage |
| Initial capital | $10,000 |
| Position size | 100% of equity per entry |
| Fees | 0.1% taker, modeled |
| Data source | Kaiko via CoinQuant |
| Baseline | ETH Buy and Hold 1D 2021-2026 (same window) |
The Backtest Results
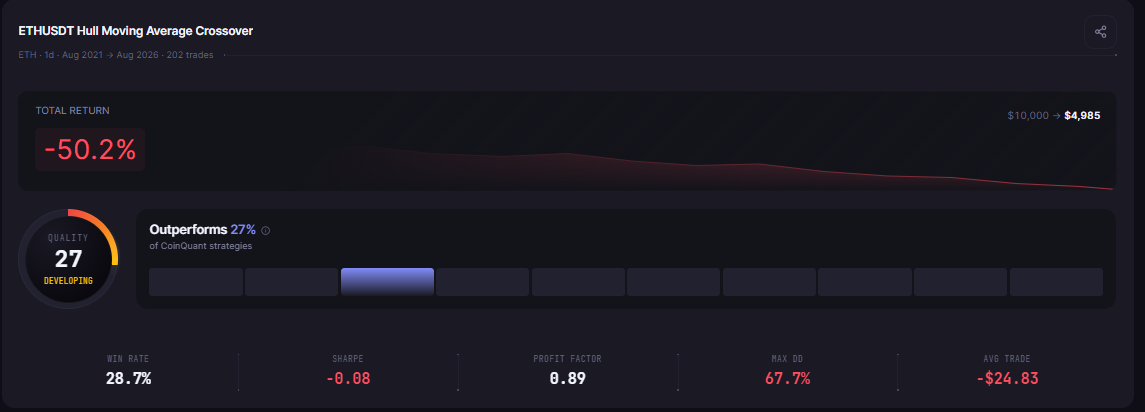
Over five years, the strategy turned $10,000 into $4,984.92, a -50.15% loss from 202 trades, while Ethereum itself fell 27.95% over the same window.
| Metric | HMA Cross | Buy and Hold |
|---|---|---|
| Total Return | -50.15% | -27.95% |
| Final Balance | $4,984.92 | $7,205.03 |
| Total Trades | 202 | 1 |
| Win Rate | 28.7% (58W / 144L) | n/a (single hold) |
| Profit Factor | 0.89 | n/a |
| Sharpe Ratio | -0.08 | 0.26 |
| Sortino Ratio | -0.11 | 0.37 |
| Max Drawdown | 67.70% | 79.30% |
| Average Win | $673.10 | n/a |
| Average Loss | $305.94 | n/a |
| Best Trade | +$2,311.96 | n/a |
| Worst Trade | -$1,358.69 | n/a |
| Time in Market | 52.00% | 100% |
| Total Fees | $3,394.92 | $17.20 |
| CAGR | -12.99% | -6.34% |
What the Data Shows
The first finding is the one that matters most: following the HMA lost to simply holding. Ethereum's -27.95% became -50.15%, even though the strategy sat out roughly half of all market days. A signal that cuts losses is supposed to finish ahead of the thing it is timing, and here it finished far behind.
The second finding is where the money went. 202 trades over five years generated $3,394.92 in fees, and the average trade was small in both directions: $673.10 for winners, $305.94 for losers. The strategy is designed to catch turns, so it should not be surprising that it traded often. What the numbers show is what the frequency costs. The profit factor of 0.89 means a dollar lost bought only 89 cents of gross profit, before counting the fee line at all.
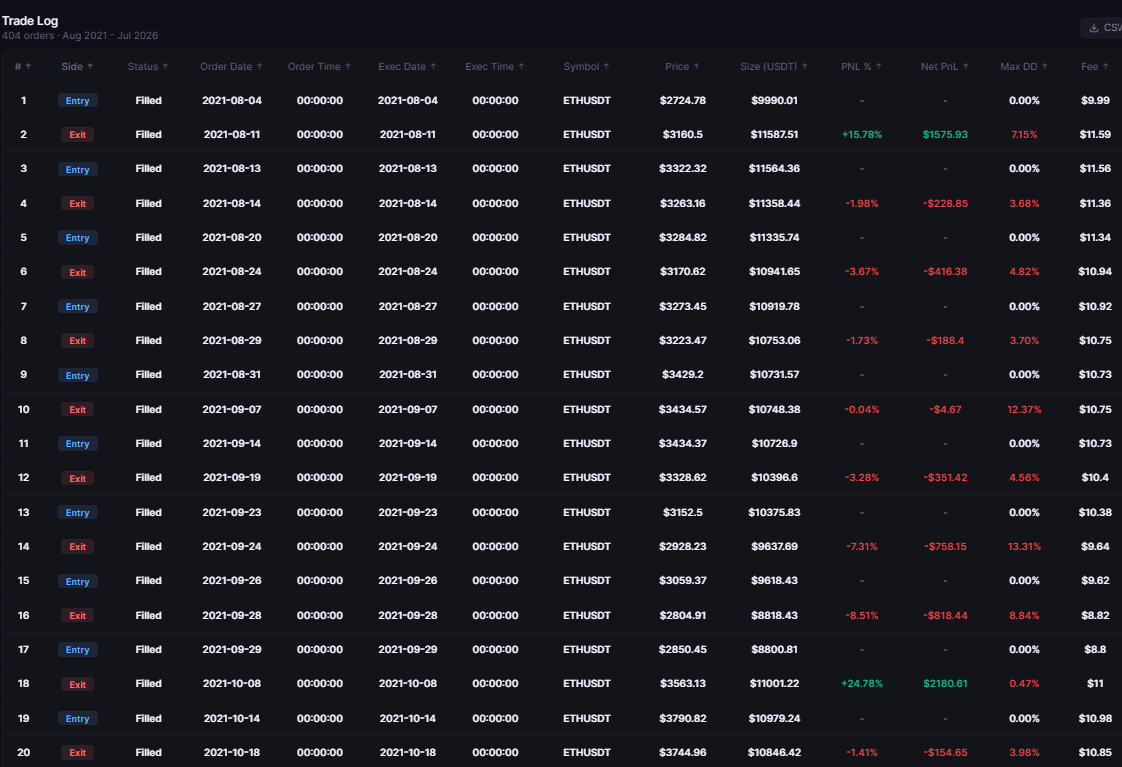
The third finding is the whipsaw pattern in the year-by-year ledger. The strategy made progress in the middle years, +$1,928.13 in 2023 and +$3,366.13 in 2024, then gave it back when the market turned choppy: -$5,026.00 in 2025 alone, plus -$2,162.26 in 2026 through August. The worst single trade, closed in March 2025, lost -$1,358.69 the day after it opened, a textbook example of the HMA catching a move that reversed immediately.
Why the Fastest Line Produced the Most Noise
The HMA's selling point is that it turns early. On a choppy asset like daily Ethereum, "turns early" and "turns on noise" are the same sentence. When every wiggle through the line triggers a new position, the strategy pays the spread of its own indecision, and 202 round trips is what that paying looks like in practice.
The contrast with holding is instructive. Buy and hold suffered a deeper maximum drawdown (79.30% versus 67.70%), but it never paid to change its mind. The HMA strategy reduced its worst drawdown by nearly 12 percentage points, and it lost just over half the account doing so.
This is the same lesson that runs through every fast-signal test in this series: speed is a property, not an edge. A fast indicator used alone mostly converts market noise into transaction costs. The indicator's own documentation recommends pairing it with confirmation such as RSI or volume filters, and this test is the data behind that recommendation.
The Practical Lesson
The raw HMA(20) cross returned -50.15% on daily ETH over five years, worse than the -27.95% from holding through the same decline
Speed was the cause: 202 trades, $3,394.92 in fees, and an average loss ($305.94) that repeated far more often than the average win ($673.10) could compensate
The drawdown was tamer than buy and hold (67.70% versus 79.30%), but the cost of that reduction was half the account
Fast signals need confirmation: the documented fixes are filters (momentum, volume, higher-timeframe trend) and a longer HMA period, each requiring its own backtest
The HMA does exactly what it promises on a chart: it hugs price and turns fast. What five years of Ethereum data shows is that on its own, that speed is a liability, because markets spend large stretches going nowhere, and every crossing in a sideways market is a small, expensive mistake. Use the HMA with a filter, or use it as a filter for something else, but this test is the reason not to follow it alone.
Run this HMA backtest yourself and test your own trend settings on CoinQuant. Backtest trend strategies free on CoinQuant
BACKTEST VERIFIED: Article 270 Strategies (both ETHUSDT 1D, 2021-08-01 to 2026-08-01): ETH Hull MA Cross 1D 2021-2026 (strategy_version_id 7849d4cb-8d74-47e1-ae5e-c9c49103d1f0, backtest_id eb51c28a-3642-42ca-af58-b461132f6246, TR -50.15%, 202 trades, 28.7% win, PF 0.89, Sharpe -0.08, DD 67.70%, fees $3,394.92, final $4,984.92); ETH Buy and Hold 1D 2021-2026 (strategy_version_id 8c4f8497-5b51-4812-bd98-49982a6adde2, backtest_id 36856864-3351-453f-a8fe-1eff9549474d, TR -27.95%, 1 trade, DD 79.30%, final $7,205.03). All metrics confirmed via GET /v1/backtests/{id}/results on 2026-09-16.
Disclaimer:
Key Takeaway
