
Win Rate vs Profit Factor: Which Number Tells You More About a Backtest?

Win Rate is the share of trades that made money. Profit Factor is gross profit divided by gross loss. In the "win rate vs profit factor" question, the second number tells you more about whether a backtest made money, because it weighs how big the wins and losses were, not just how often each happened.
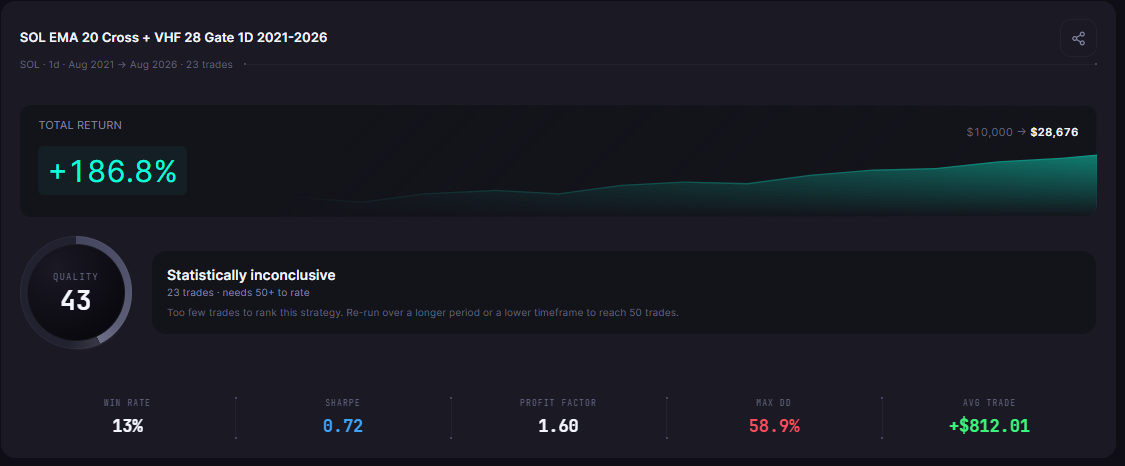
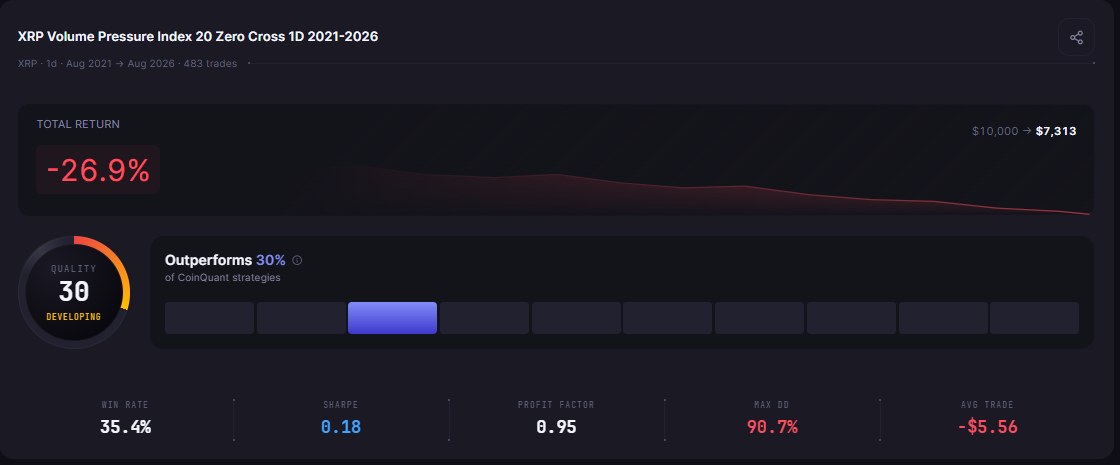
Three backtests the author ran on CoinQuant, an AI trading platform, show the gap. The rule with the lowest Win Rate, 13.04%, had the highest Profit Factor, 1.60, and returned 186.76%. The rule with the highest Win Rate, 35.40%, had a Profit Factor of 0.95 and lost 26.87%.
Neither number is enough alone, and the trade count matters as much as either. This comparison sets out what each measures, what each hides and how to read Win Rate and Profit Factor together.
Win Rate vs Profit Factor: What We Compare and How
We judge both numbers on the same three questions: what each measures, what each hides and how each behaves when a backtest has few trades. No winner is declared up front.
The examples are three strategies tested on CoinQuant. All three ran on daily candles (Binance spot, Kaiko via CoinQuant) from 1 August 2021 to 1 August 2026, with $10,000, 100% of equity per trade and a 0.1% fee on entry and exit. Fees are included in every figure; no slippage was modelled. The strategies are examples, not the subject.
What Each Number Measures
- Win Rate: winning trades divided by all trades. A Win Rate of 35.40% on 483 trades means 171 winners and 312 losers.
- Profit Factor: the money made on winning trades divided by the money lost on losing trades. Above 1.00 the rule made money overall; below 1.00 it lost.
| Dimension | Win Rate | Profit Factor |
|---|---|---|
| What it measures | How often trades end in profit | Whether the wins paid for the losses |
| Break even level | No fixed level; it depends on win and loss size | 1.00 |
| What it hides | How big the wins and losses were | How often you are wrong, and losing streaks |
| With few trades | Jumps with each trade | Can rest on one or two big wins |
| On a CoinQuant results card | Win Rate, in the bottom row | Profit Factor, in the bottom row |
| Verdict | Read it second, as a guide to how often a rule is wrong | Read it first, together with the trade count |
For Profit Factor on its own, see what a good Profit Factor is in crypto trading.
The Link Between Them: Average Win vs Average Loss
The two numbers are tied together by the size of the average win against the average loss. Profit Factor equals the number of wins times the Average Win, divided by the number of losses times the Average Loss.
So a low Win Rate can still make money if each win is far larger than each loss. A high Win Rate can still lose money if each loss is larger than each win.
Win Rate vs Risk Reward
Traders often call the win to loss size ratio "risk reward". CoinQuant's API reports it as the Payoff Ratio: the Average Win divided by the Average Loss. The lower the Win Rate, the higher that ratio has to be for a rule to break even.
Three Verified Results Where the Numbers Disagree
| Metric | SOL EMA 20 + VHF 28 | XRP Volume Pressure Index 20 | ADA MACD 12-26-9 |
|---|---|---|---|
| Strategy | SOL EMA 20 Cross + VHF 28 Gate 1D 2021-2026 | XRP Volume Pressure Index 20 Zero Cross 1D 2021-2026 | ADA MACD 12-26-9 Cross 1D 2021-2026 |
| Win Rate | 13.04% (3W / 20L) | 35.40% (171W / 312L) | 28.57% (18W / 45L) |
| Profit Factor | 1.60 | 0.95 | 0.85 |
| Average Win | $16,556.06 | $307.32 | $2,069.54 |
| Average Loss | $1,549.60 | $177.05 | $968.80 |
| Payoff Ratio | 10.68 | 1.74 | 2.14 |
| Total Trades | 23 | 483 | 63 |
| Total Return | 186.76% | -26.87% | -63.44% |
| Max Drawdown | 58.90% | 90.70% | 88.56% |
| Total Fees | $1,100.83 | $5,667.41 | $1,052.86 |
All three runs share the same window, capital, sizing and fee, so the rows compare like with like.
The SOL rule won only three of 23 trades, but its Average Win was more than ten times its Average Loss. That is why its Profit Factor reached 1.60. With 23 trades, its results card shows a QUALITY of 43 next to "Statistically inconclusive" (23 trades · needs 50+ to rate), so the result says little on its own.
The XRP rule won more often, 171 times out of 483, yet lost money. Its Average Win was less than twice its Average Loss, which was not enough at that Win Rate, so its Profit Factor fell to 0.95. Across 483 trades it also paid $5,667.41 in fees. Its card shows a QUALITY of 30.
The ADA rule sits between them. It won 28.57% of 63 trades with an Average Win about twice its Average Loss, and that still left a Profit Factor of 0.85 and a loss of 63.44%.
Which Number to Read First
Read Profit Factor first, with the trade count next to it. A Profit Factor above 1.00 on many trades is evidence; on 23 trades it is a hint. For how many trades a test needs, see how many trades a backtest needs before you can trust it.
Then read Win Rate with the Average Win and Average Loss. Together they explain the Profit Factor and show how often the rule was wrong.
The ADA rule shows that the trade count is no shortcut either. Its 63 trades clear the 50 trades the results card needs before it rates a run, and its Profit Factor of 0.85 still says plainly that the rule lost money.
A single big winner can carry a whole backtest, and an average can hide it. For that problem, see average trade vs median trade.
Where Each Number Is Better
| Where Win Rate helps | Where Profit Factor helps |
|---|---|
| Easy to feel: it says how often you will be wrong | Says whether the wins paid for the losses |
| Warns of long losing streaks at low levels (the SOL rule lost 20 of 23 trades) | Flags a losing rule even when it wins often (the XRP rule, 0.95) |
| Helps judge whether you could stick with a rule | Includes the size of every win and loss |
Both have a place: Win Rate for whether you can live with a rule, Profit Factor for whether it pays. Risk numbers are a separate question; for those, see Sharpe Ratio vs Sortino Ratio.
Limits
- Costs: fees included, no slippage modelled.
- Small samples: 23 trades can show almost any Win Rate; the SOL result is "Statistically inconclusive".
- Three examples: they show how the numbers can disagree, not how often.
- Data note: XRPUSDT daily data has a gap from 9 to 15 September 2021 that the platform does not flag, and one XRP trade (8 to 16 September 2021, -$456.98) spans it. ADAUSDT has a gap from 12 to 14 September 2021; the ADA rule's first trade came on 3 October 2021.
- Past results: they do not predict future results.
The Practical Lesson
- Never judge by Win Rate alone: the 13.04% rule made money and the 35.40% rule lost it.
- Read the pair: Profit Factor, the Average Win and Average Loss, and the trade count, together.
- Check the sample: under 50 trades, the card says "Statistically inconclusive" for a reason.
Every CoinQuant results card shows Win Rate and Profit Factor in its bottom row, so both can be read at a glance.
Build trading strategies on real data. No coding required.
Frequently Asked Questions
Is Win Rate or Profit Factor More Important?
Profit Factor, read with the trade count, because it shows whether the wins paid for the losses. Win Rate matters as a second check on how often a rule is wrong.
What Is a Good Profit Factor?
Above 1.00 means the rule made money overall, and the more trades behind it, the more it means. The SOL example reached 1.60, but on only 23 trades.
Can a Strategy With a 20% Win Rate Be Profitable?
Yes, if its wins are much larger than its losses. The SOL rule won 13.04% of its trades and returned 186.76%, because its Average Win was more than ten times its Average Loss.
Read both numbers on your own rule, with fees included, before you trust either one.
Disclaimer:
This content is for educational and informational purposes only and does not constitute financial, investment, or trading advice. All strategies and examples are for illustrative purposes and do not guarantee results. Always conduct your own research before making financial decisions.