
What Is a Good Profit Factor in Crypto Trading? How to Read It in a Backtest

Profit factor is gross profit divided by gross loss. Add up the money made by every winning trade and divide it by the money lost on every losing trade. Above 1.0, the strategy made money after fees. Below 1.0, it lost.
So what is a good profit factor? As a general guide, above 1.2 after fees is a real but modest edge and 1.5 or more is strong. Anything above 2.0 deserves suspicion until the trade count backs it up.
This guide reads profit factor in three real backtests from the CoinQuant Strategy Library. Their profit factors sit between 1.38 and 1.45, and trade count and drawdown change what each one means.
What Profit Factor Measures (and What It Ignores)
Profit factor compares everything a strategy won with everything it lost, in one number, and it is a headline figure in every backtest report. The formula:
Profit factor = gross profit ÷ gross loss
A reading of 1.5 means the strategy earned 1.50 for every 1.00 it gave back. In CoinQuant backtests it is built from each trade's net result after fees.
What it ignores matters just as much:
Sample size. Four trades and 400 trades can print the same ratio.
The path. It ignores the order of results, so it cannot show how deep the account fell along the way.
Trade sizing. With 100% of equity per trade, position size follows the account, so trades taken when the account is larger move the ratio more.
The benchmark. A ratio above 1.0 does not mean the strategy beat holding the asset.
What Counts as a Good Profit Factor
There is no official threshold. These rough bands are general guidance for results that already include fees:
| Profit factor (after fees) | How to read it | What to check next |
|---|---|---|
| Below 1.0 | The strategy lost money | Whether the signal or the fees caused the loss |
| 1.0 to 1.2 | Break-even to thin; small changes in fees or fills can erase it | Fee sensitivity and trade count |
| 1.2 to 1.5 | A modest, real edge if the sample is large enough | Trade count and max drawdown |
| 1.5 to 2.0 | Strong | Whether a few trades carry the result |
| Above 2.0 | Unusually high for a simple rule | Sample size and overfitting |
Trading styles reach these bands differently. Trend strategies often win less than half the time on a few large winners, while mean reversion wins more often with smaller gains. Both can land on the same ratio, so read trade count and drawdown next.
Three Backtests, Nearly the Same Profit Factor
All three results come from the CoinQuant Strategy Library and share one setup: Binance spot data from Kaiko via CoinQuant, daily bars from August 1, 2021 to August 1, 2026, $10,000 of starting capital, 100% of equity per trade and a 0.1% taker fee on every fill. No slippage was set.
| Metric | Lead case | Contrast 1 | Contrast 2 |
|---|---|---|---|
| Strategy | ETH WMA 20/50 Cross 1D 2021-2026 | DEMA 21/50 | ETH Efficiency Ratio Trend Filter 1D 2021-2026 |
| Instrument and timeframe | ETHUSDT, 1D | BTCUSDT, 1D | ETHUSDT, 1D |
| Profit Factor | 1.45 | 1.44 | 1.38 |
| Total Trades | 24 | 22 | 4 |
| Win Rate | 41.67% | 36.36% | 25.00% |
| Max Drawdown | 54.15% | 61.66% | 29.50% |
| Total Return | +58.53% | +73.10% | +7.37% |
ETH WMA 20/50 Cross 1D 2021-2026 buys when the 20-period weighted moving average crosses above the 50-period one and sells on the cross back below. Over 24 trades it won 41.67% of the time: 10 winners averaging $1,888.97 against 14 losers averaging $931.22.
Winners were about twice the size of losers, a payoff ratio of 2.03. That is how a strategy that lost more often than it won still reached a profit factor of 1.45 and a +58.53% return.
The other two rows look like near copies. They are not.
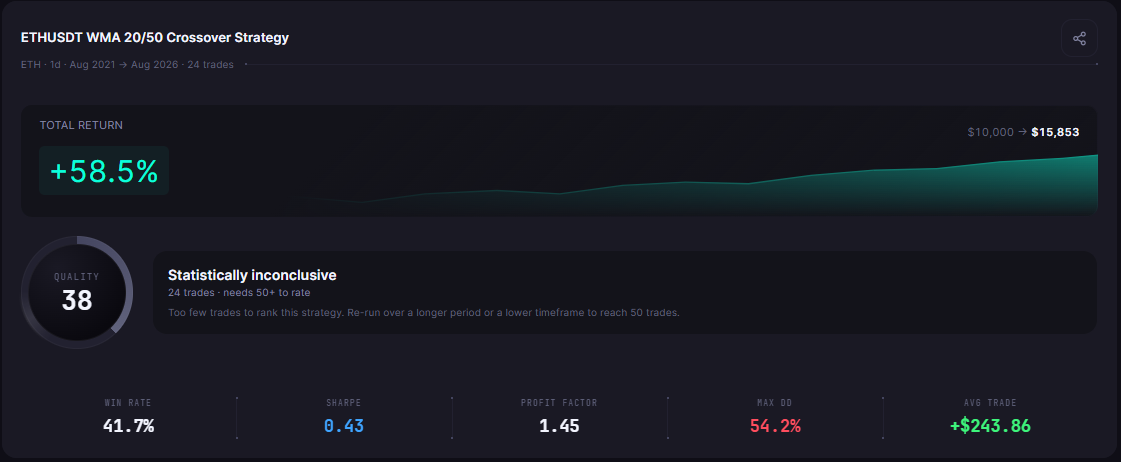
ETH WMA 20/50 Cross 1D 2021-2026: a 1.45 profit factor from 24 trades, with a 54.15% max drawdown (CoinQuant backtest, 2021 to 2026).
Screenshot from the author's CoinQuant account. Backtest results are hypothetical, based on historical data with modelled fees, and do not guarantee future performance. Not financial advice.
When a Good PF Is Not Enough: Trade Count and Drawdown
Trade count: four trades is an anecdote
ETH Efficiency Ratio Trend Filter 1D 2021-2026 posts a profit factor of 1.38 from just four trades. One of them won. Its average win of $2,690.51 is also its best trade, so the entire ratio rests on a single position.
It was in the market 7.01% of the time across five years. That is the filter working as designed, not proof of an edge. As a rule of thumb, treat any profit factor from fewer than 30 trades as a hypothesis to re-test on another window. Even the lead case, at 24 trades, is a small sample.
Drawdown: same ratio, different pain
DEMA 21/50, which runs on BTCUSDT daily, and ETH WMA 20/50 Cross 1D 2021-2026 are near twins on profit factor at 1.44 and 1.45. Their drawdowns are not: 61.66% for DEMA 21/50 against 54.15% for the WMA cross.
Both hit a worst run of five losing trades in a row, but the DEMA losses were larger: $1,185.74 on average against $931.22. Its wins were larger too, so the ratio barely moved.
Profit factor only sums results; it cannot see how deep the account fell. For a per trade view, expectancy is the better companion: the average trade made $243.86 for the WMA cross, $332.25 for DEMA 21/50 and $184.34 for the Efficiency Ratio filter.
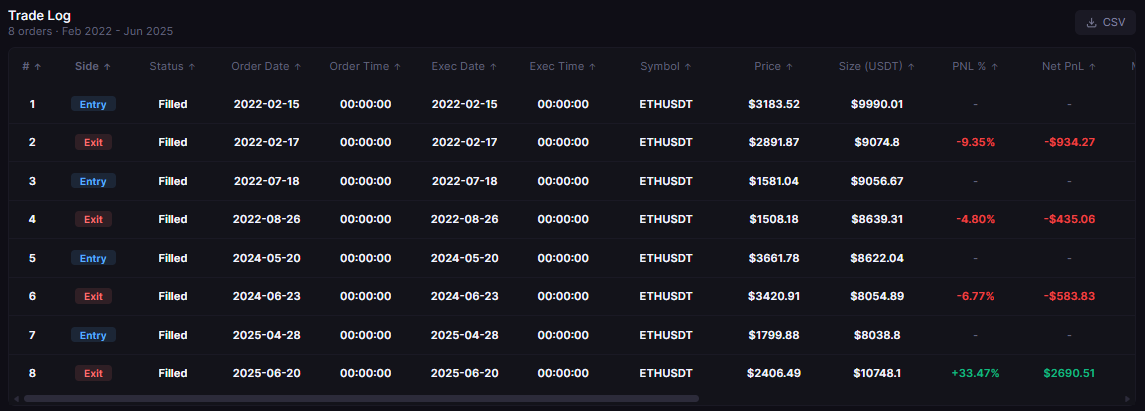
ETH Efficiency Ratio Trend Filter 1D 2021-2026: a 1.38 profit factor from only four trades, one of them a winner.
Screenshot from the author's CoinQuant account. Backtest results are hypothetical, based on historical data with modelled fees, and do not guarantee future performance. Not financial advice.
Mistakes Traders Make With Profit Factor
Reading it before the trade count. A ratio from a handful of trades says more about luck than skill.
Comparing across different setups. Crypto profit factor figures only compare fairly on the same fee model and window.
Tuning settings until it peaks. Maximising profit factor on one window usually fits the past. Confirm any change on a second window.
Ignoring drawdown. A 1.45 you abandon at minus 54.15% earns you nothing. Read it next to max drawdown and the Sharpe ratio, as covered in how to read backtest results.
Assuming it beats holding. Check the Buy & Hold line on the same backtest chart.
The Practical Lesson
Profit factor is the fastest way to see whether wins outweigh losses, and the easiest number to read too much into. Run this check before you trust it:
Find the ratio next to total trades, win rate and max drawdown in your results.
Check the trade count first. Under about 30 trades, treat the ratio as a hypothesis.
Read max drawdown next and ask whether you would have kept trading through it.
Open the trade log. Use Download Data to export the trades and see whether one or two positions carry the result.
Re-test on a second window with the same fees and sizing.
To try it, type a strategy into CoinQuant in plain English:
Buy ETHUSDT on the daily chart when the 20-period WMA crosses above the 50-period WMA. Sell when the 20-period WMA crosses back below the 50-period WMA. Test from August 1, 2021 to August 1, 2026 with $10,000, 100% of equity per trade and a 0.1% fee.
CoinQuant, the AI trading platform, turns that description into rules and reports profit factor, total trades, win rate, max drawdown and Sharpe side by side. Build trading strategies on real data. No coding required.
Read your own profit factor alongside trade count and drawdown. Backtest your strategy free
Disclaimer:
Key Takeaway
